Correction (October 8, 2026): The share of students represented by the larger-cohort comparison is 42.9% of Missouri's published statewide graduating cohort. An earlier version reported 43.0% using only the district rows retained for the comparison. Graduation rates and district ranks are unchanged.
Correction (September 19, 2026): An earlier version of this article compared St. Joseph with 452 districts and said 26 districts had at least 500 students in their 2024 cohort, representing 41.7% of students. The comparison had dropped Fort Zumwalt, which changed its reported name between 2023 and 2024. With districts matched by their state ID, the comparison includes 453 districts, and 27 districts with at least 500 students, representing 43.0% of students. St. Joseph's rank, seventh overall and first among the larger districts, is unchanged.
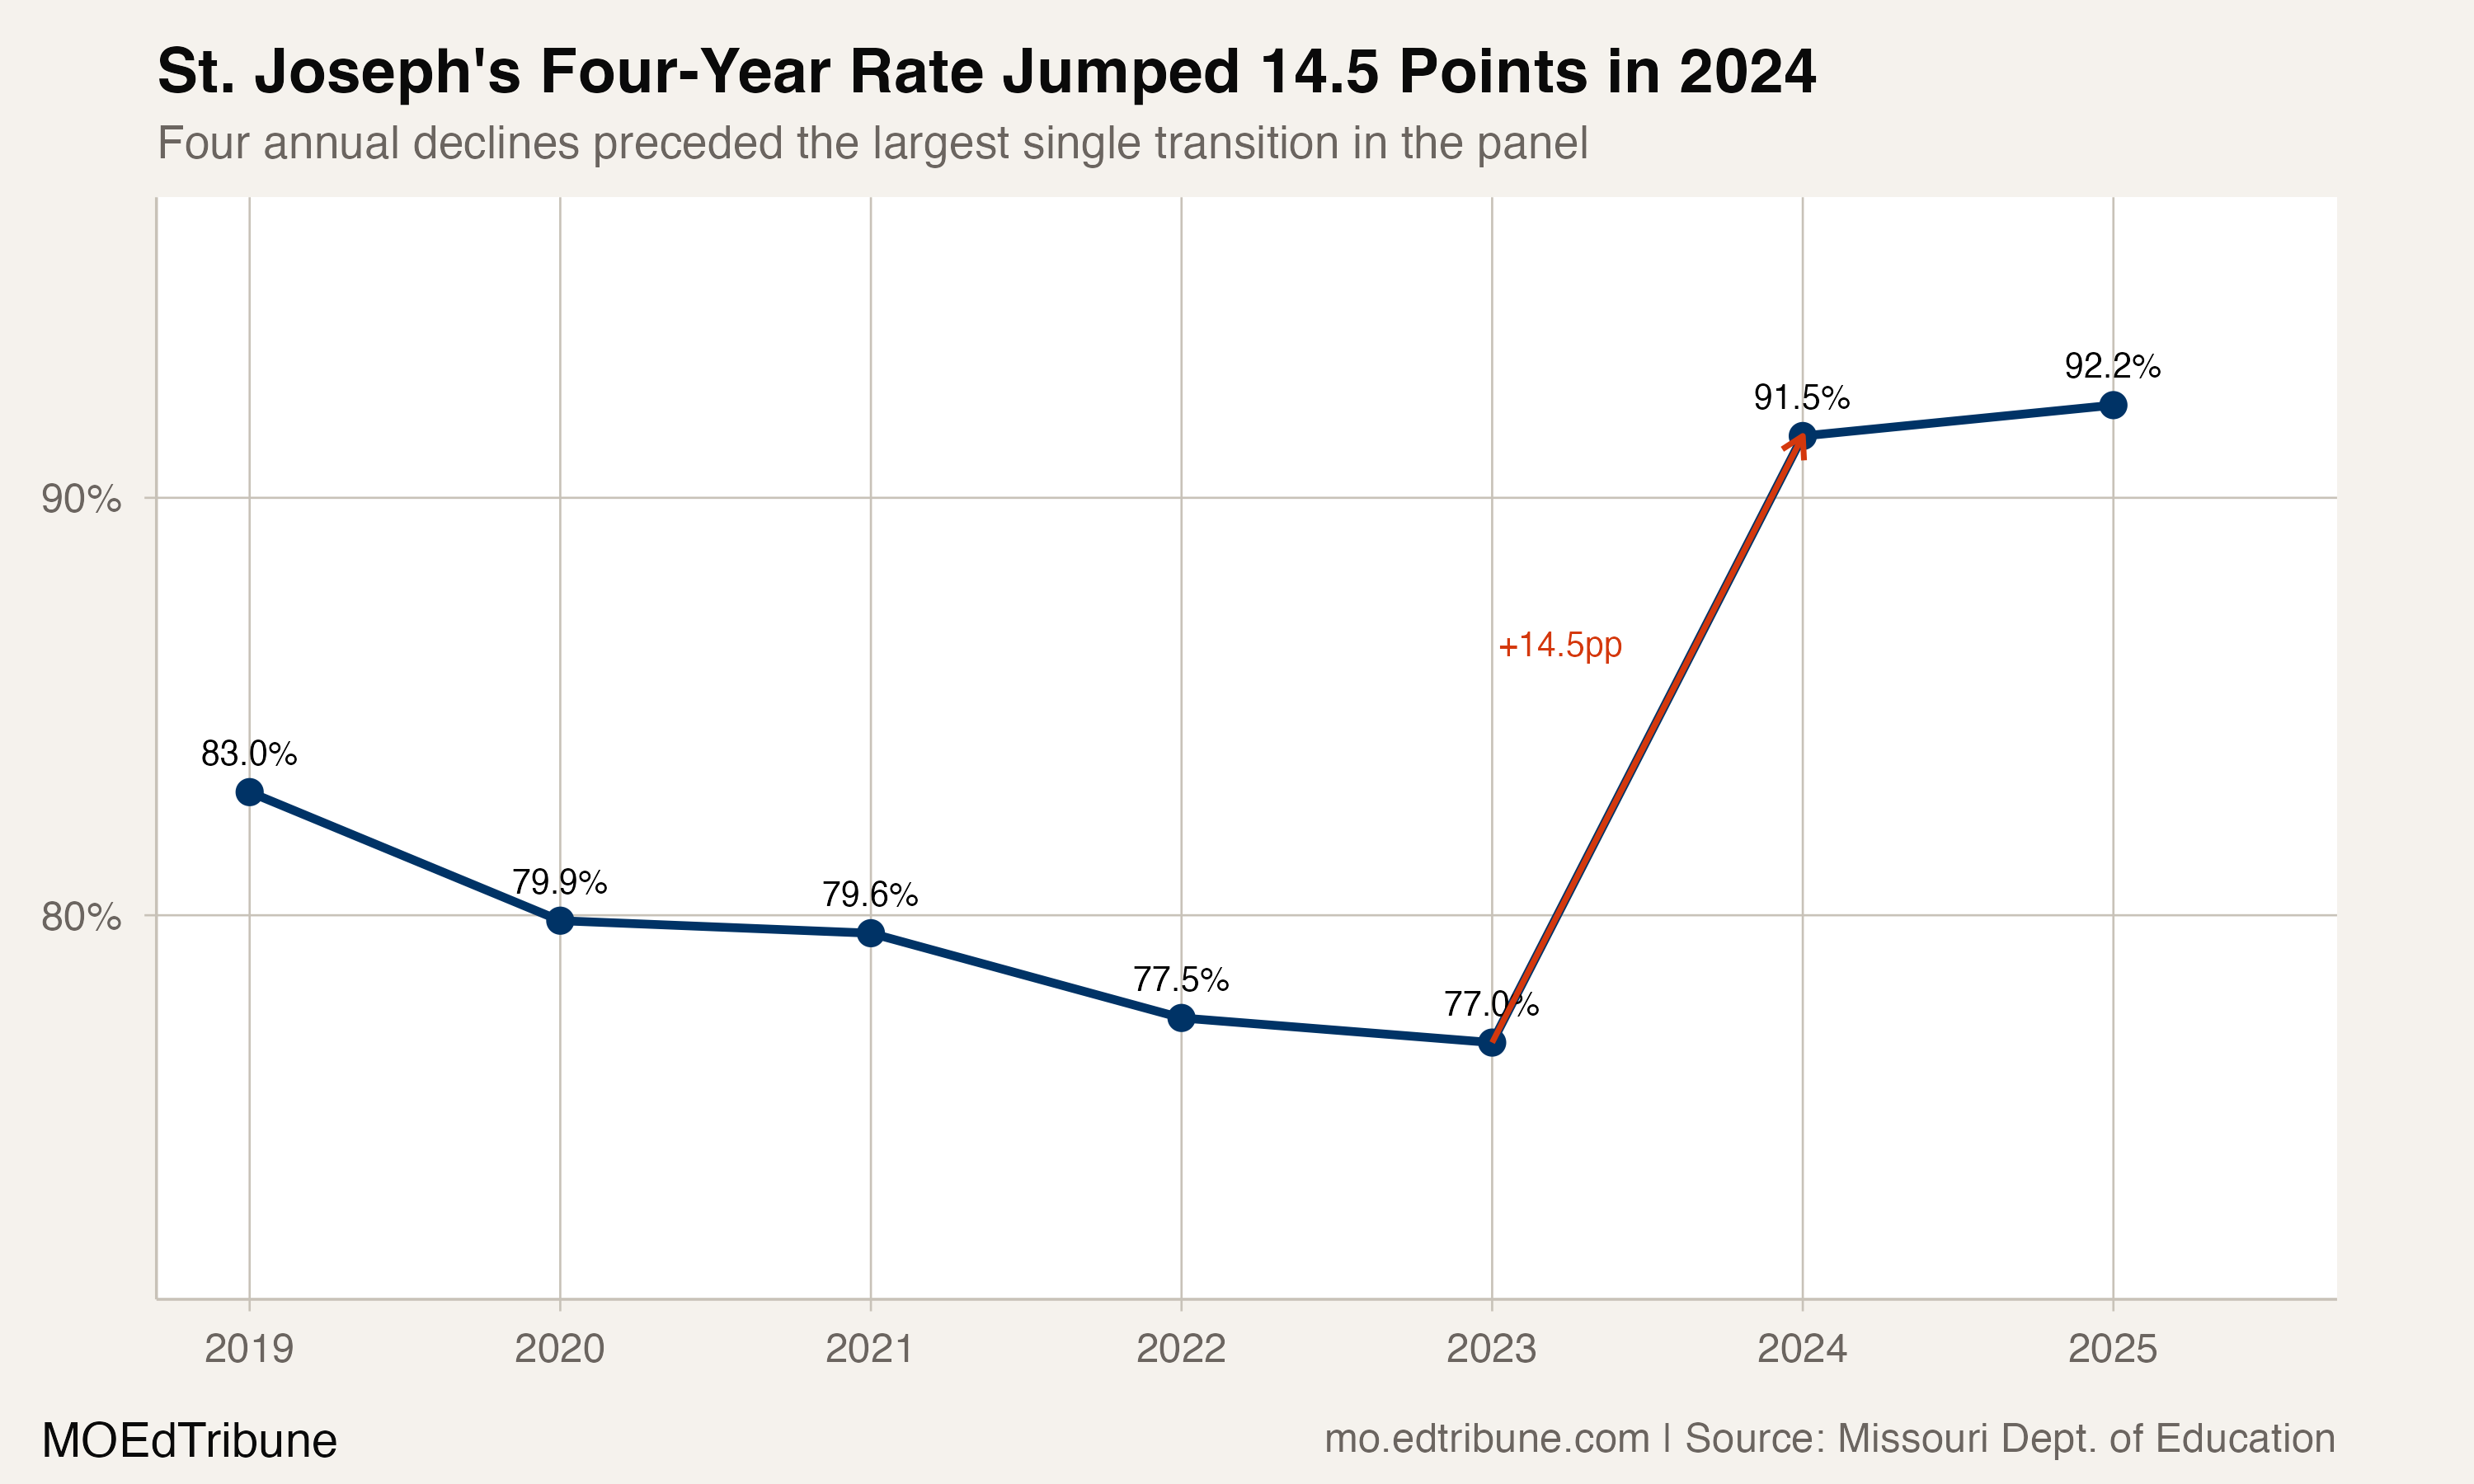
The four-year graduation rate at St. Joseph↗ET fell in four consecutive annual transitions, from 83.0% in 2019 to 77.0% in 2023. It then rose 14.5 percentage points to 91.5% in 2024 and added another 0.7 points to reach 92.2% in 2025.
The 2024 cohort included 751 students; the 2025 cohort included 733. The size makes the reversal less susceptible to the swings seen in very small cohorts, but the graduation files do not identify what caused it.
How unusual was the jump?
Among 453 Missouri districts with valid 2023 and 2024 endpoints, St. Joseph's increase ranked seventh. Six smaller-cohort districts posted larger changes.
With an editorial cutoff of at least 500 students in the 2024 cohort, St. Joseph ranked first among 27 districts. Those districts represented 42.9% of the students in the state's published four-year graduating cohort. At a 1,000-student cutoff, St. Joseph is excluded. The rank therefore describes a defined size universe, not a natural category.
The 2025 follow-through
The 2025 rate of 92.2% extended the higher level by one reporting year. That persistence is stronger evidence than a one-year spike alone, but it does not distinguish among district intervention, cohort composition, and reporting effects.
The four-year and five-year comparison
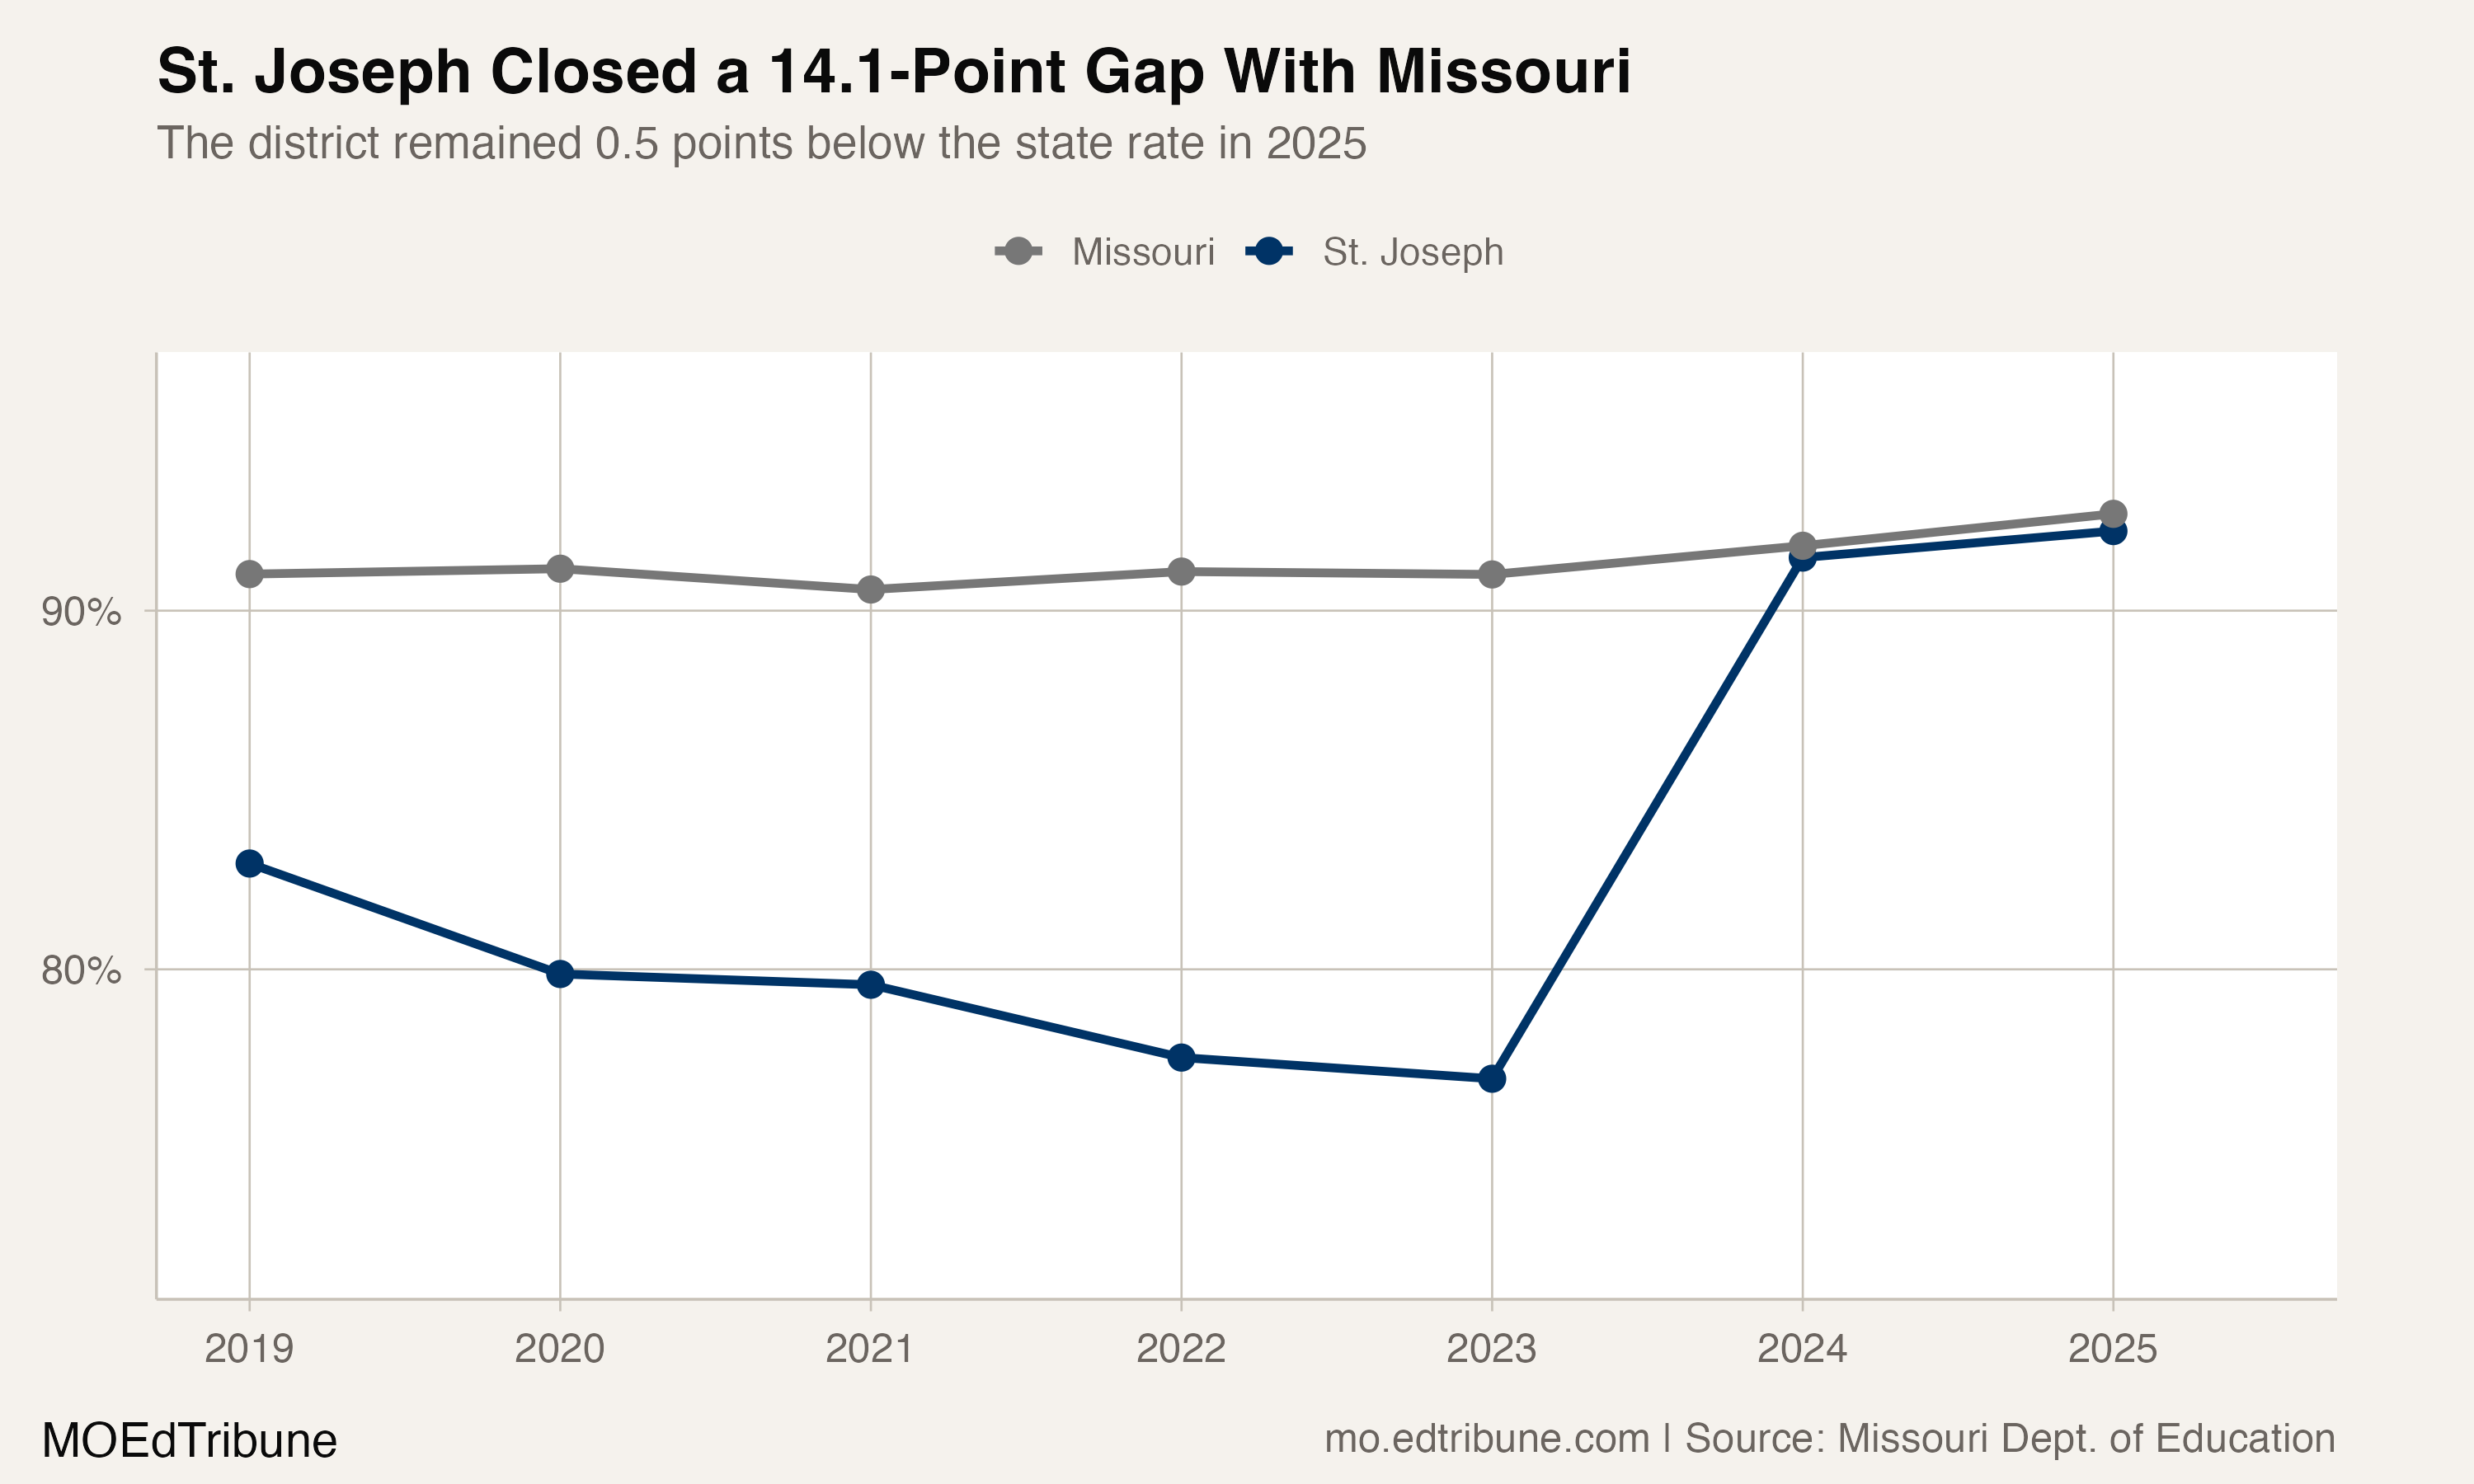
The published five-year series remained at 78.0% in 2023 and 2024, then rose to 92.2% in 2025. The increase appeared one reporting year after the four-year jump.
Four-year and five-year rates describe different cohort windows. Their timing is consistent with a lagged change, but the aggregate files cannot establish that the same individual students moved from later completion to on-time completion.
From trailing to at parity
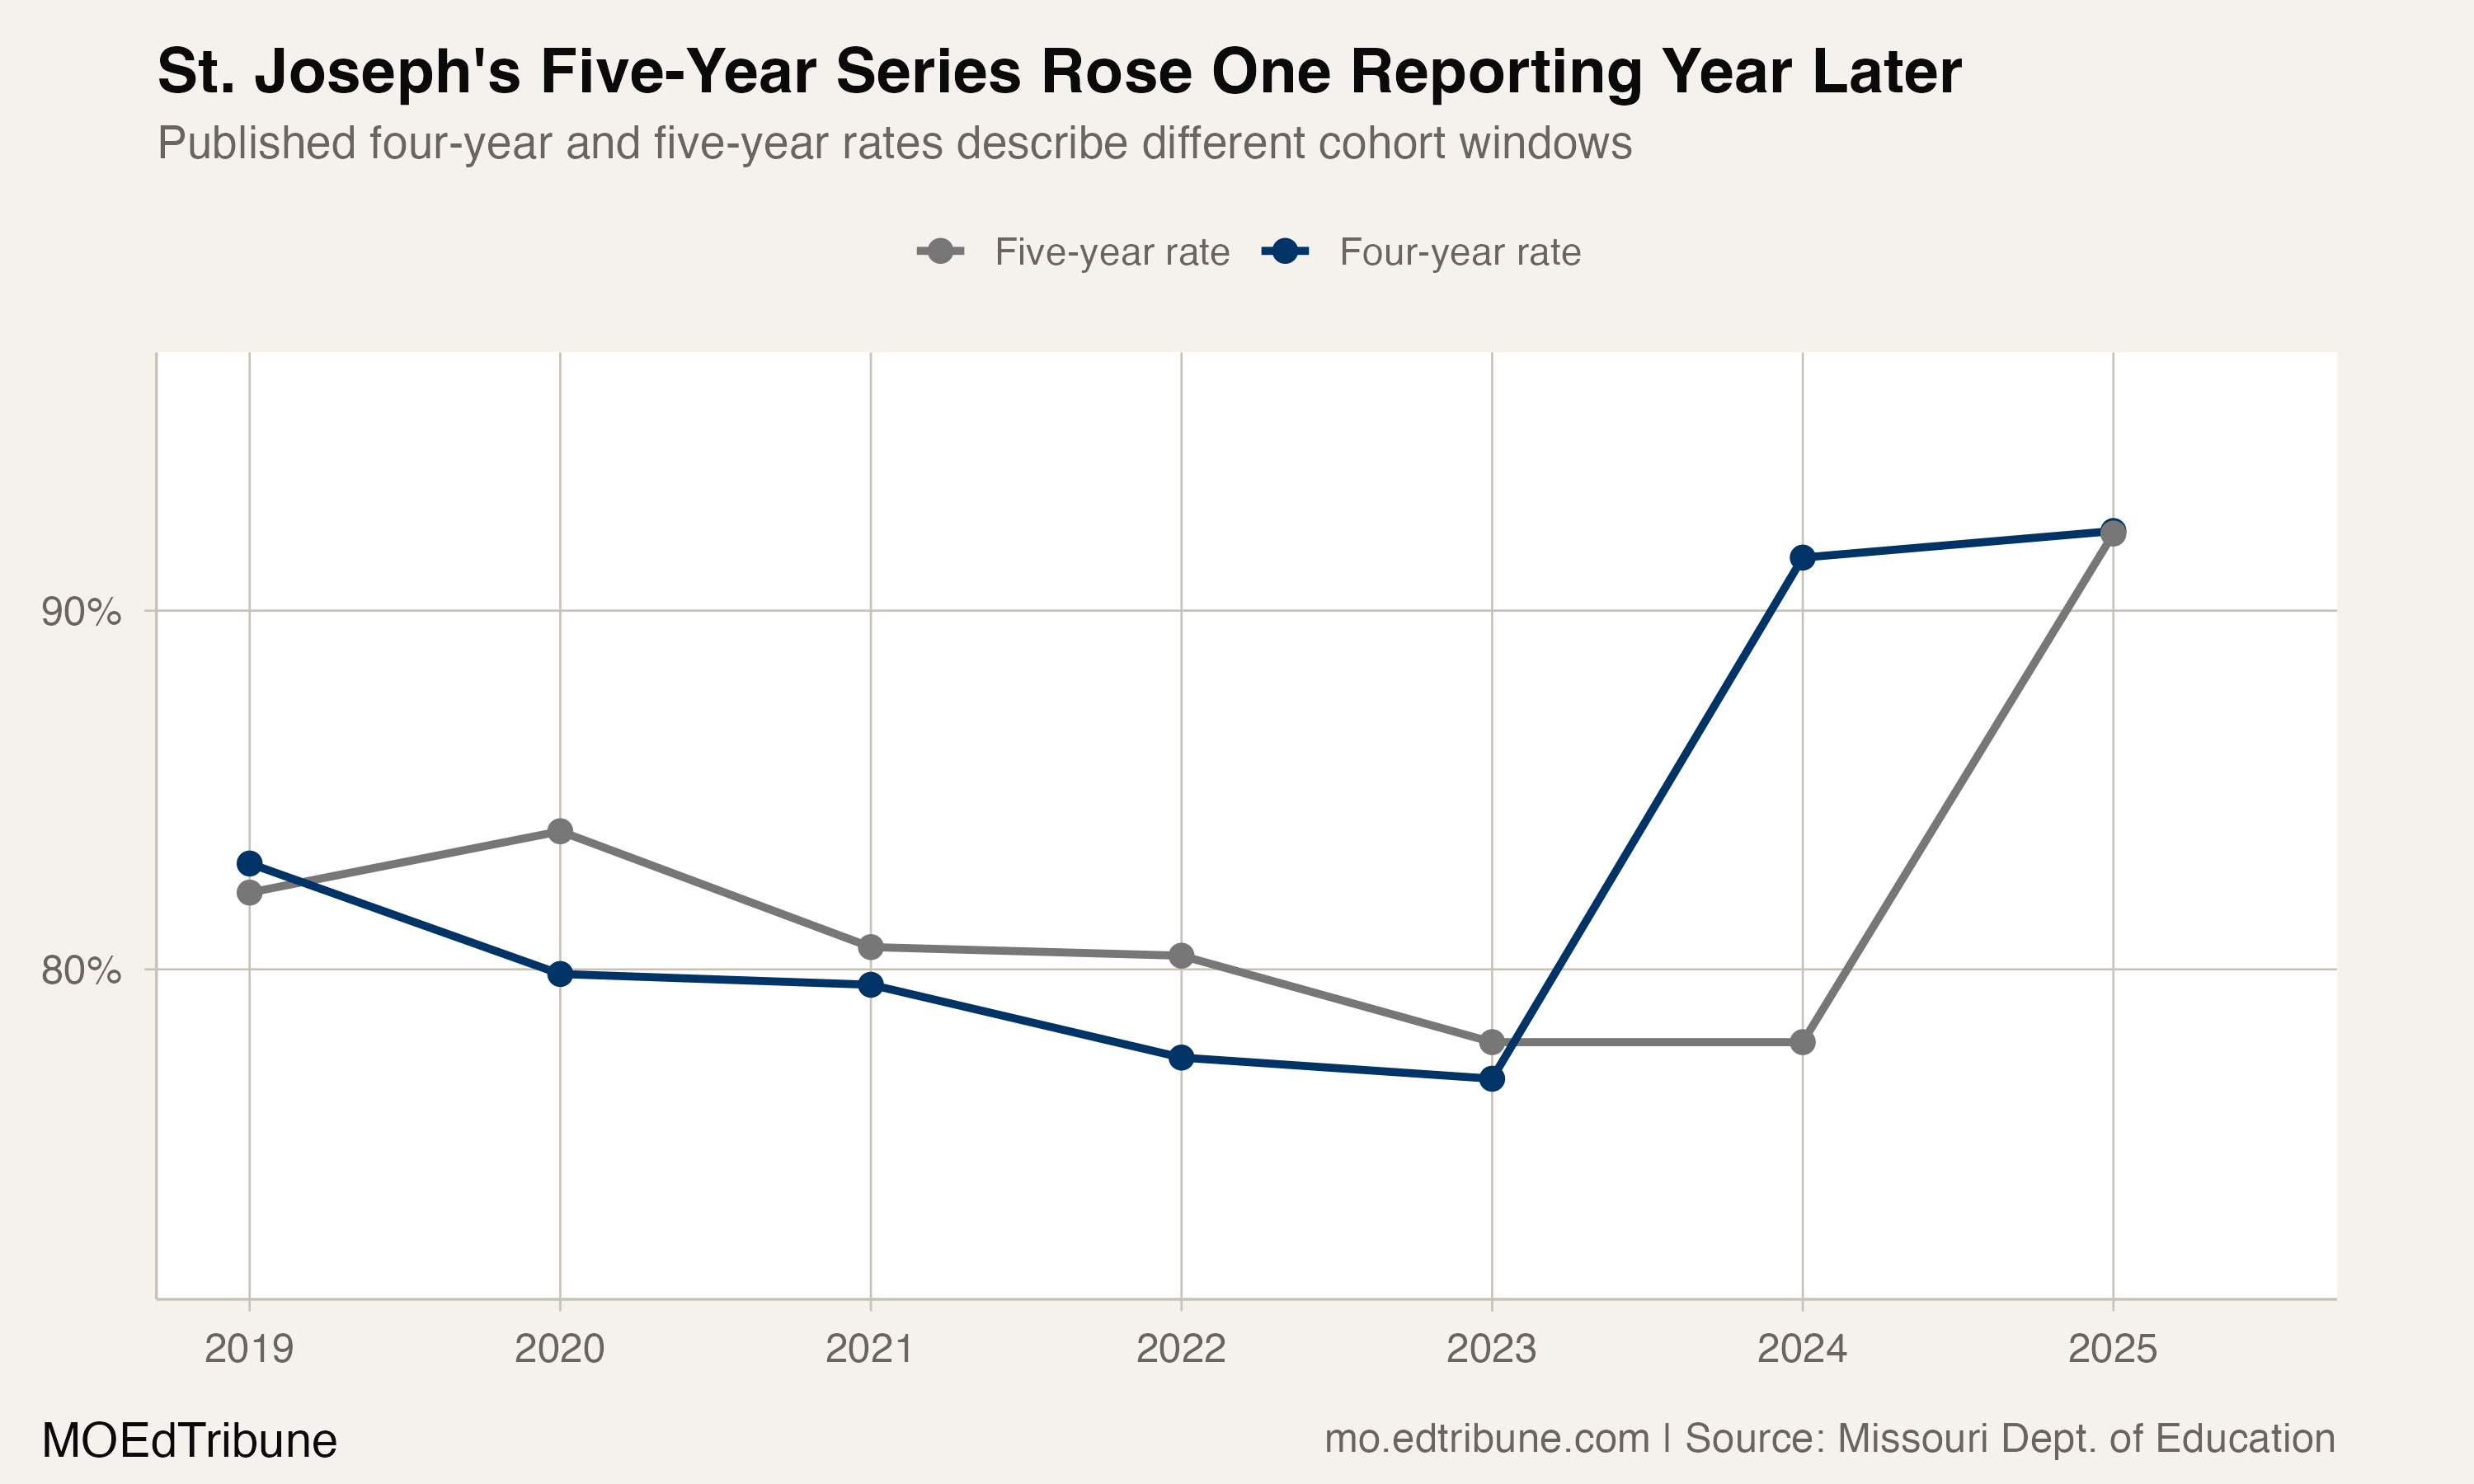
In 2023, St. Joseph was 14.1 points below Missouri's 91.0% rate. In 2024, it was 0.3 points below the state, and in 2025 it was 0.5 points below. The district moved from a wide deficit to near parity across two annual transitions.
The data supports calling the change large, sustained for one additional year, and unusual in both the full statewide universe and the defined larger-cohort universe. It does not yet support a causal explanation.
Data source: Analysis based on graduation data from the Missouri Department of Elementary and Secondary Education.
Detailed code that reproduces the analysis and figures in this article is available exclusively to EdTribune subscribers.
Discussion
Sign in to join the discussion.
Loading comments...