Correction (October 8, 2026): An earlier version treated the district’s decline as proof of systemic problems and ruled out pandemic effects without evidence establishing those causes. It also called the adjusted cohort a graduating class. This version separates the measured outcomes from explanations and defines the statewide streak comparison’s complete-data universe.
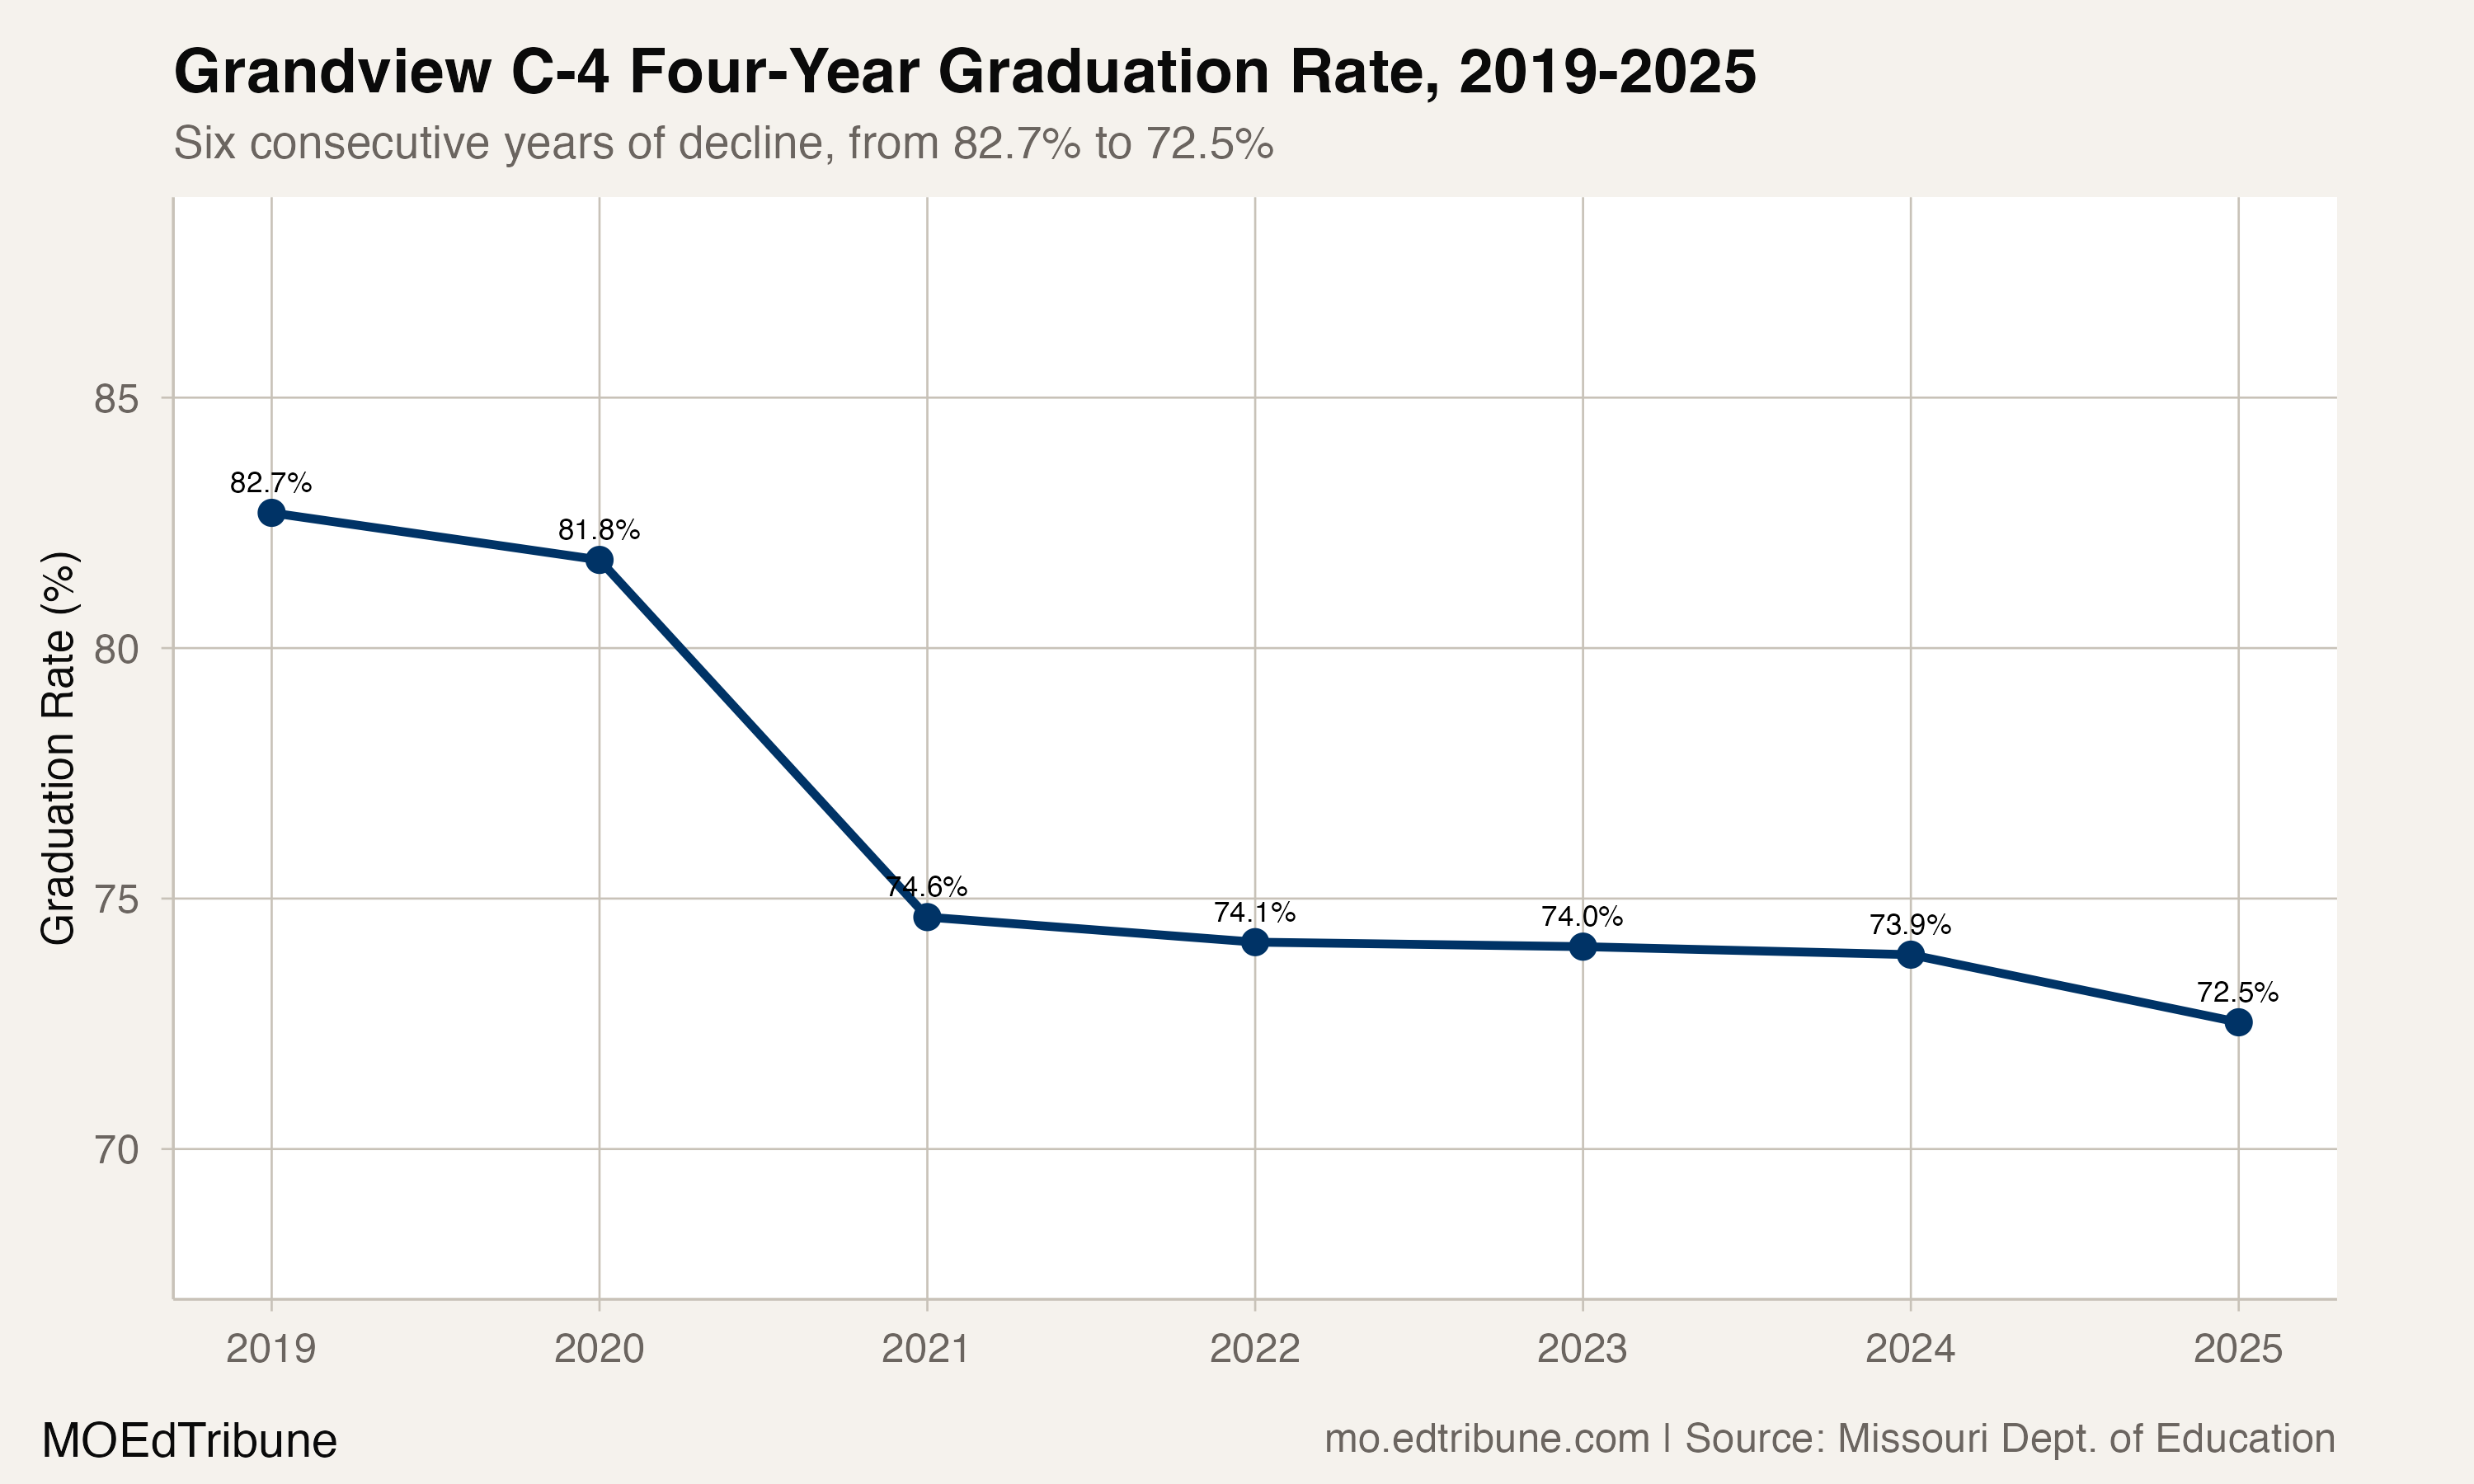
Grandview C-4↗ET recorded six consecutive declines in its published four-year graduation rate between 2018-19 and 2024-25. The available sequence, by school-year end, was 82.7%, 81.8%, 74.6%, 74.1%, 74.0%, 73.9% and 72.5%. The endpoint decline was 10.2 percentage points.
The district had the longest decline streak ending in 2024-25 among the 149 Missouri districts with a published rate in every year of this comparison and an adjusted cohort above 100 students in its final year. That is an observed-window comparison. Districts without complete rates or with smaller final cohorts are outside that ranking.
A widening gap with Blue Springs
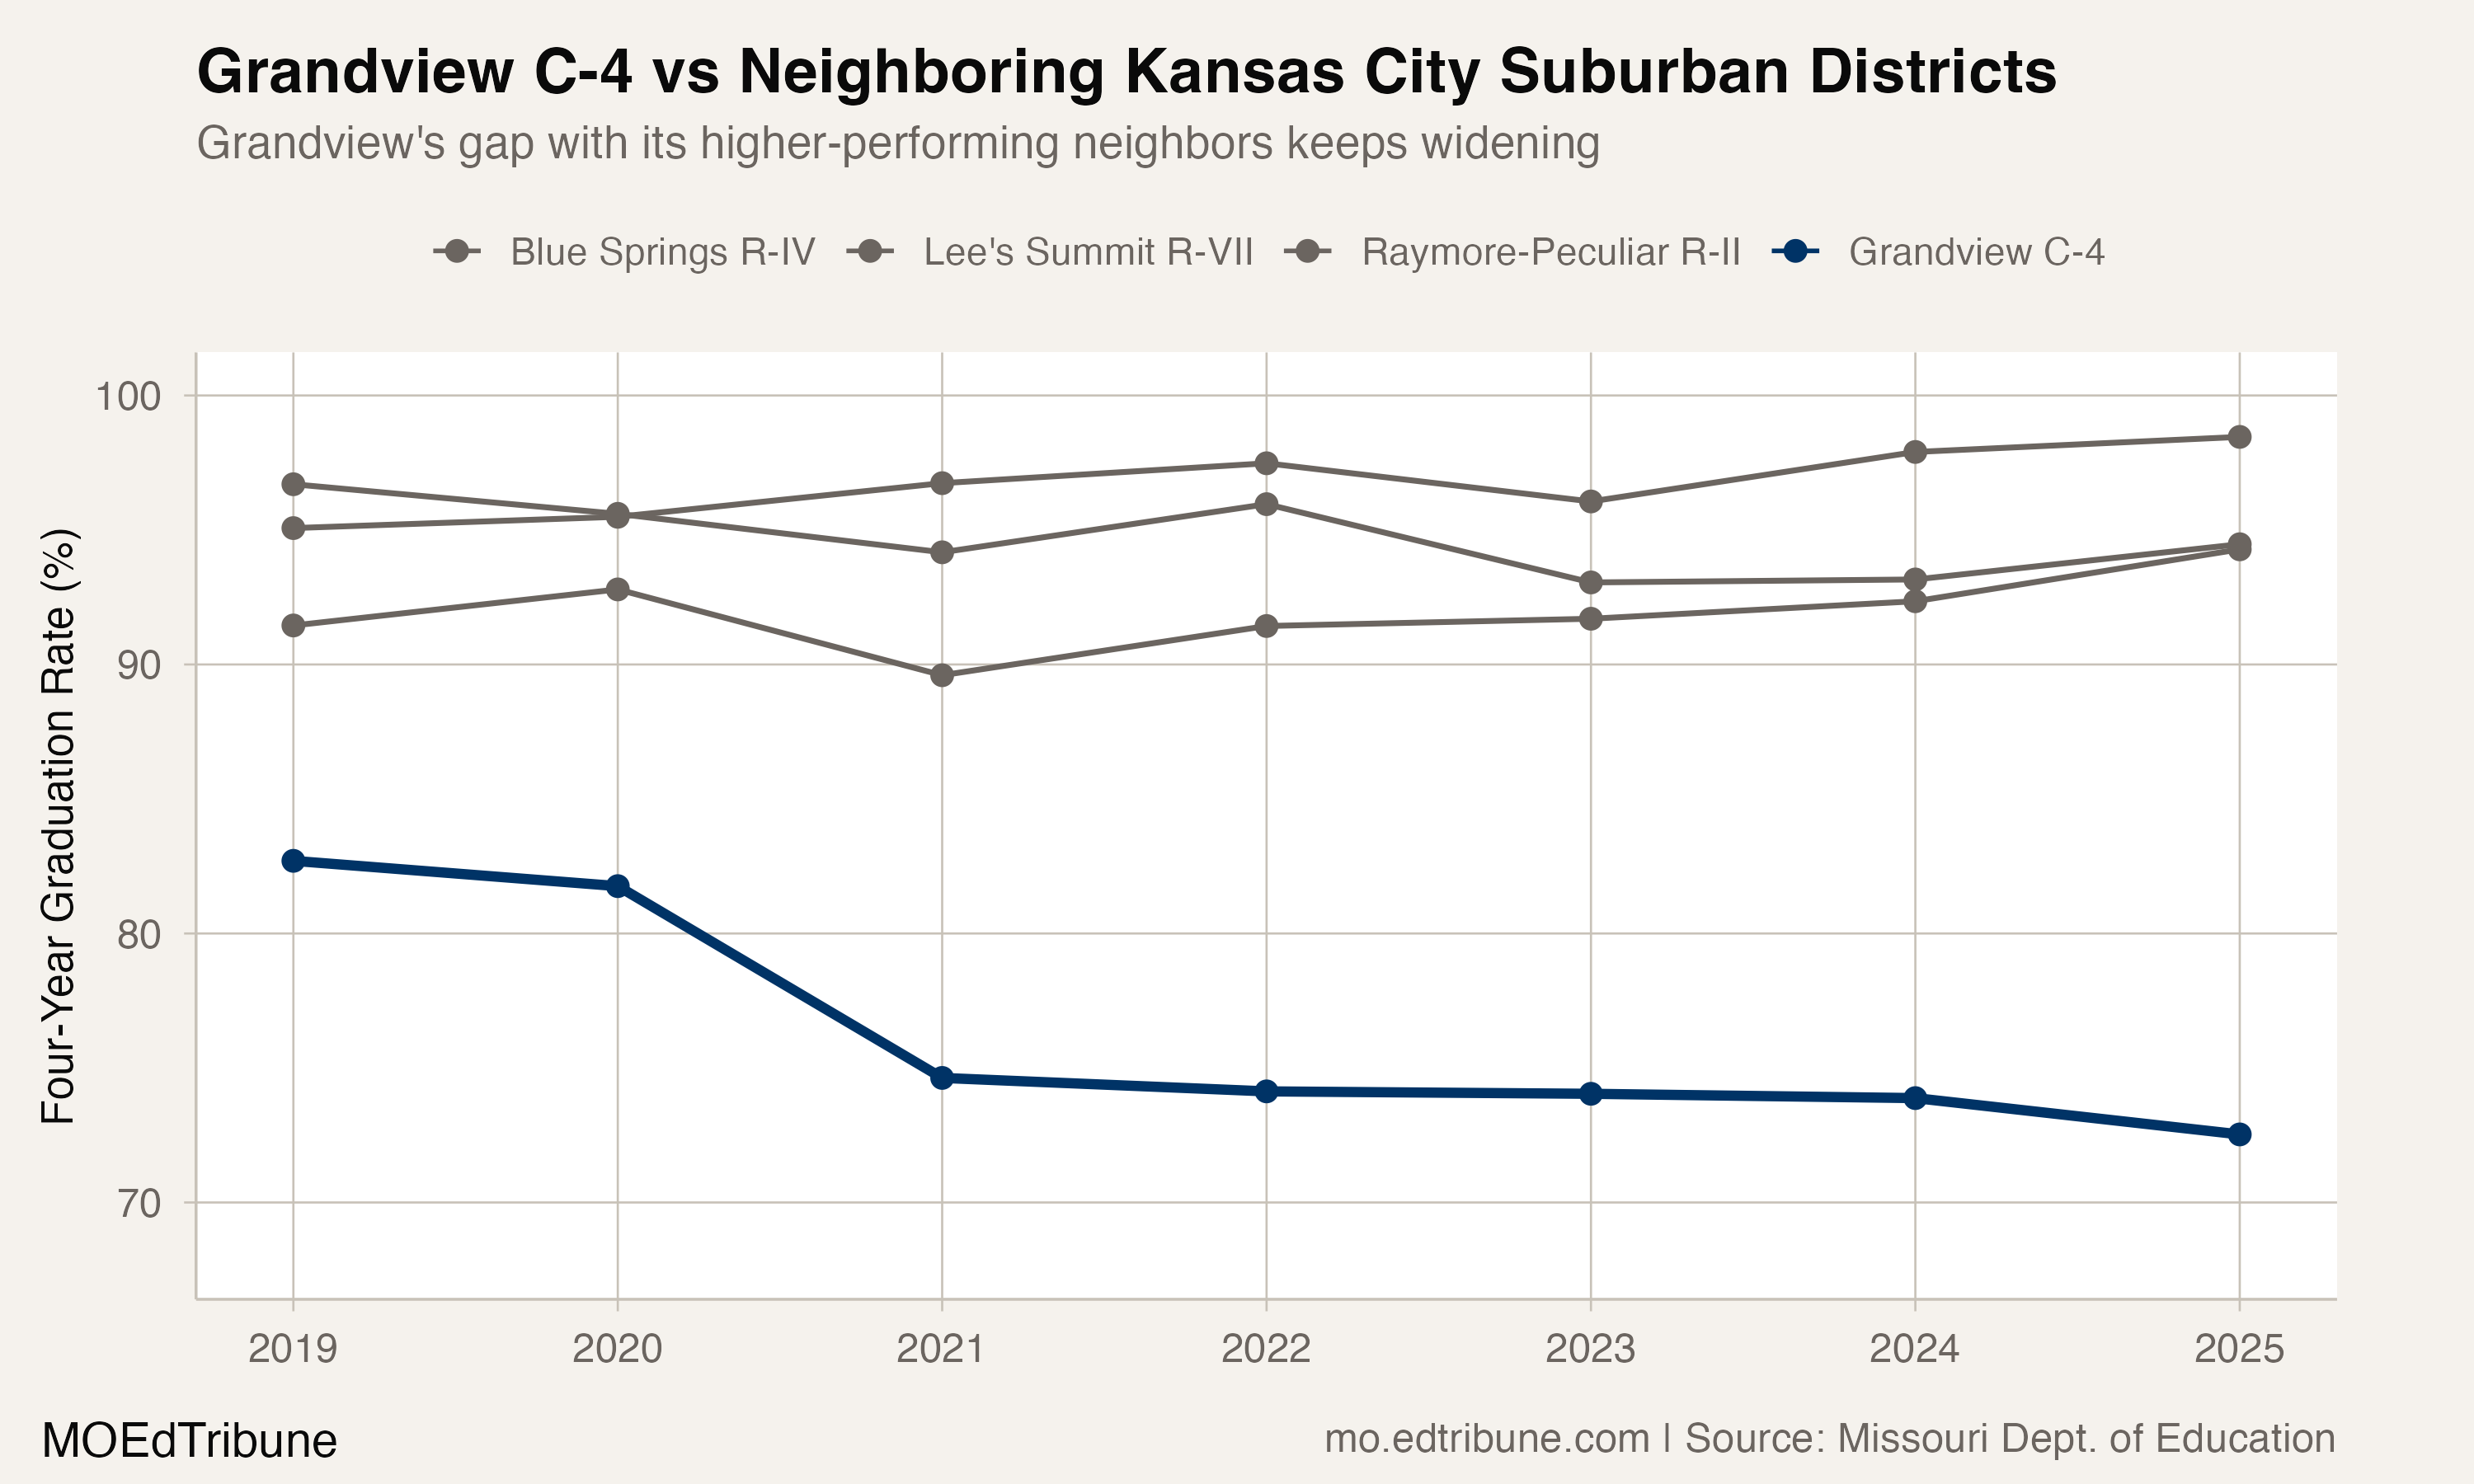
The comparison with three other Kansas City-area districts shows how far apart their published rates stood at the end of the window. Blue Springs R-IV↗ET reported 98.5% in 2024-25, Raymore-Peculiar R-II↗ET reported 94.3%, and Lee’s Summit R-VII↗ET reported 94.5%.
Blue Springs and Raymore-Peculiar recorded their highest rates in the available comparison in that final year. Lee’s Summit’s final rate was below its earlier peak. These are comparisons of each district’s reported outcomes, rather than evidence that the districts served identical students or faced identical circumstances.
Grandview’s final rate trailed Blue Springs by about 26 percentage points. At the beginning of the window, the gap was about 12 points. The unrounded difference more than doubled between those endpoints.
The adjusted cohort
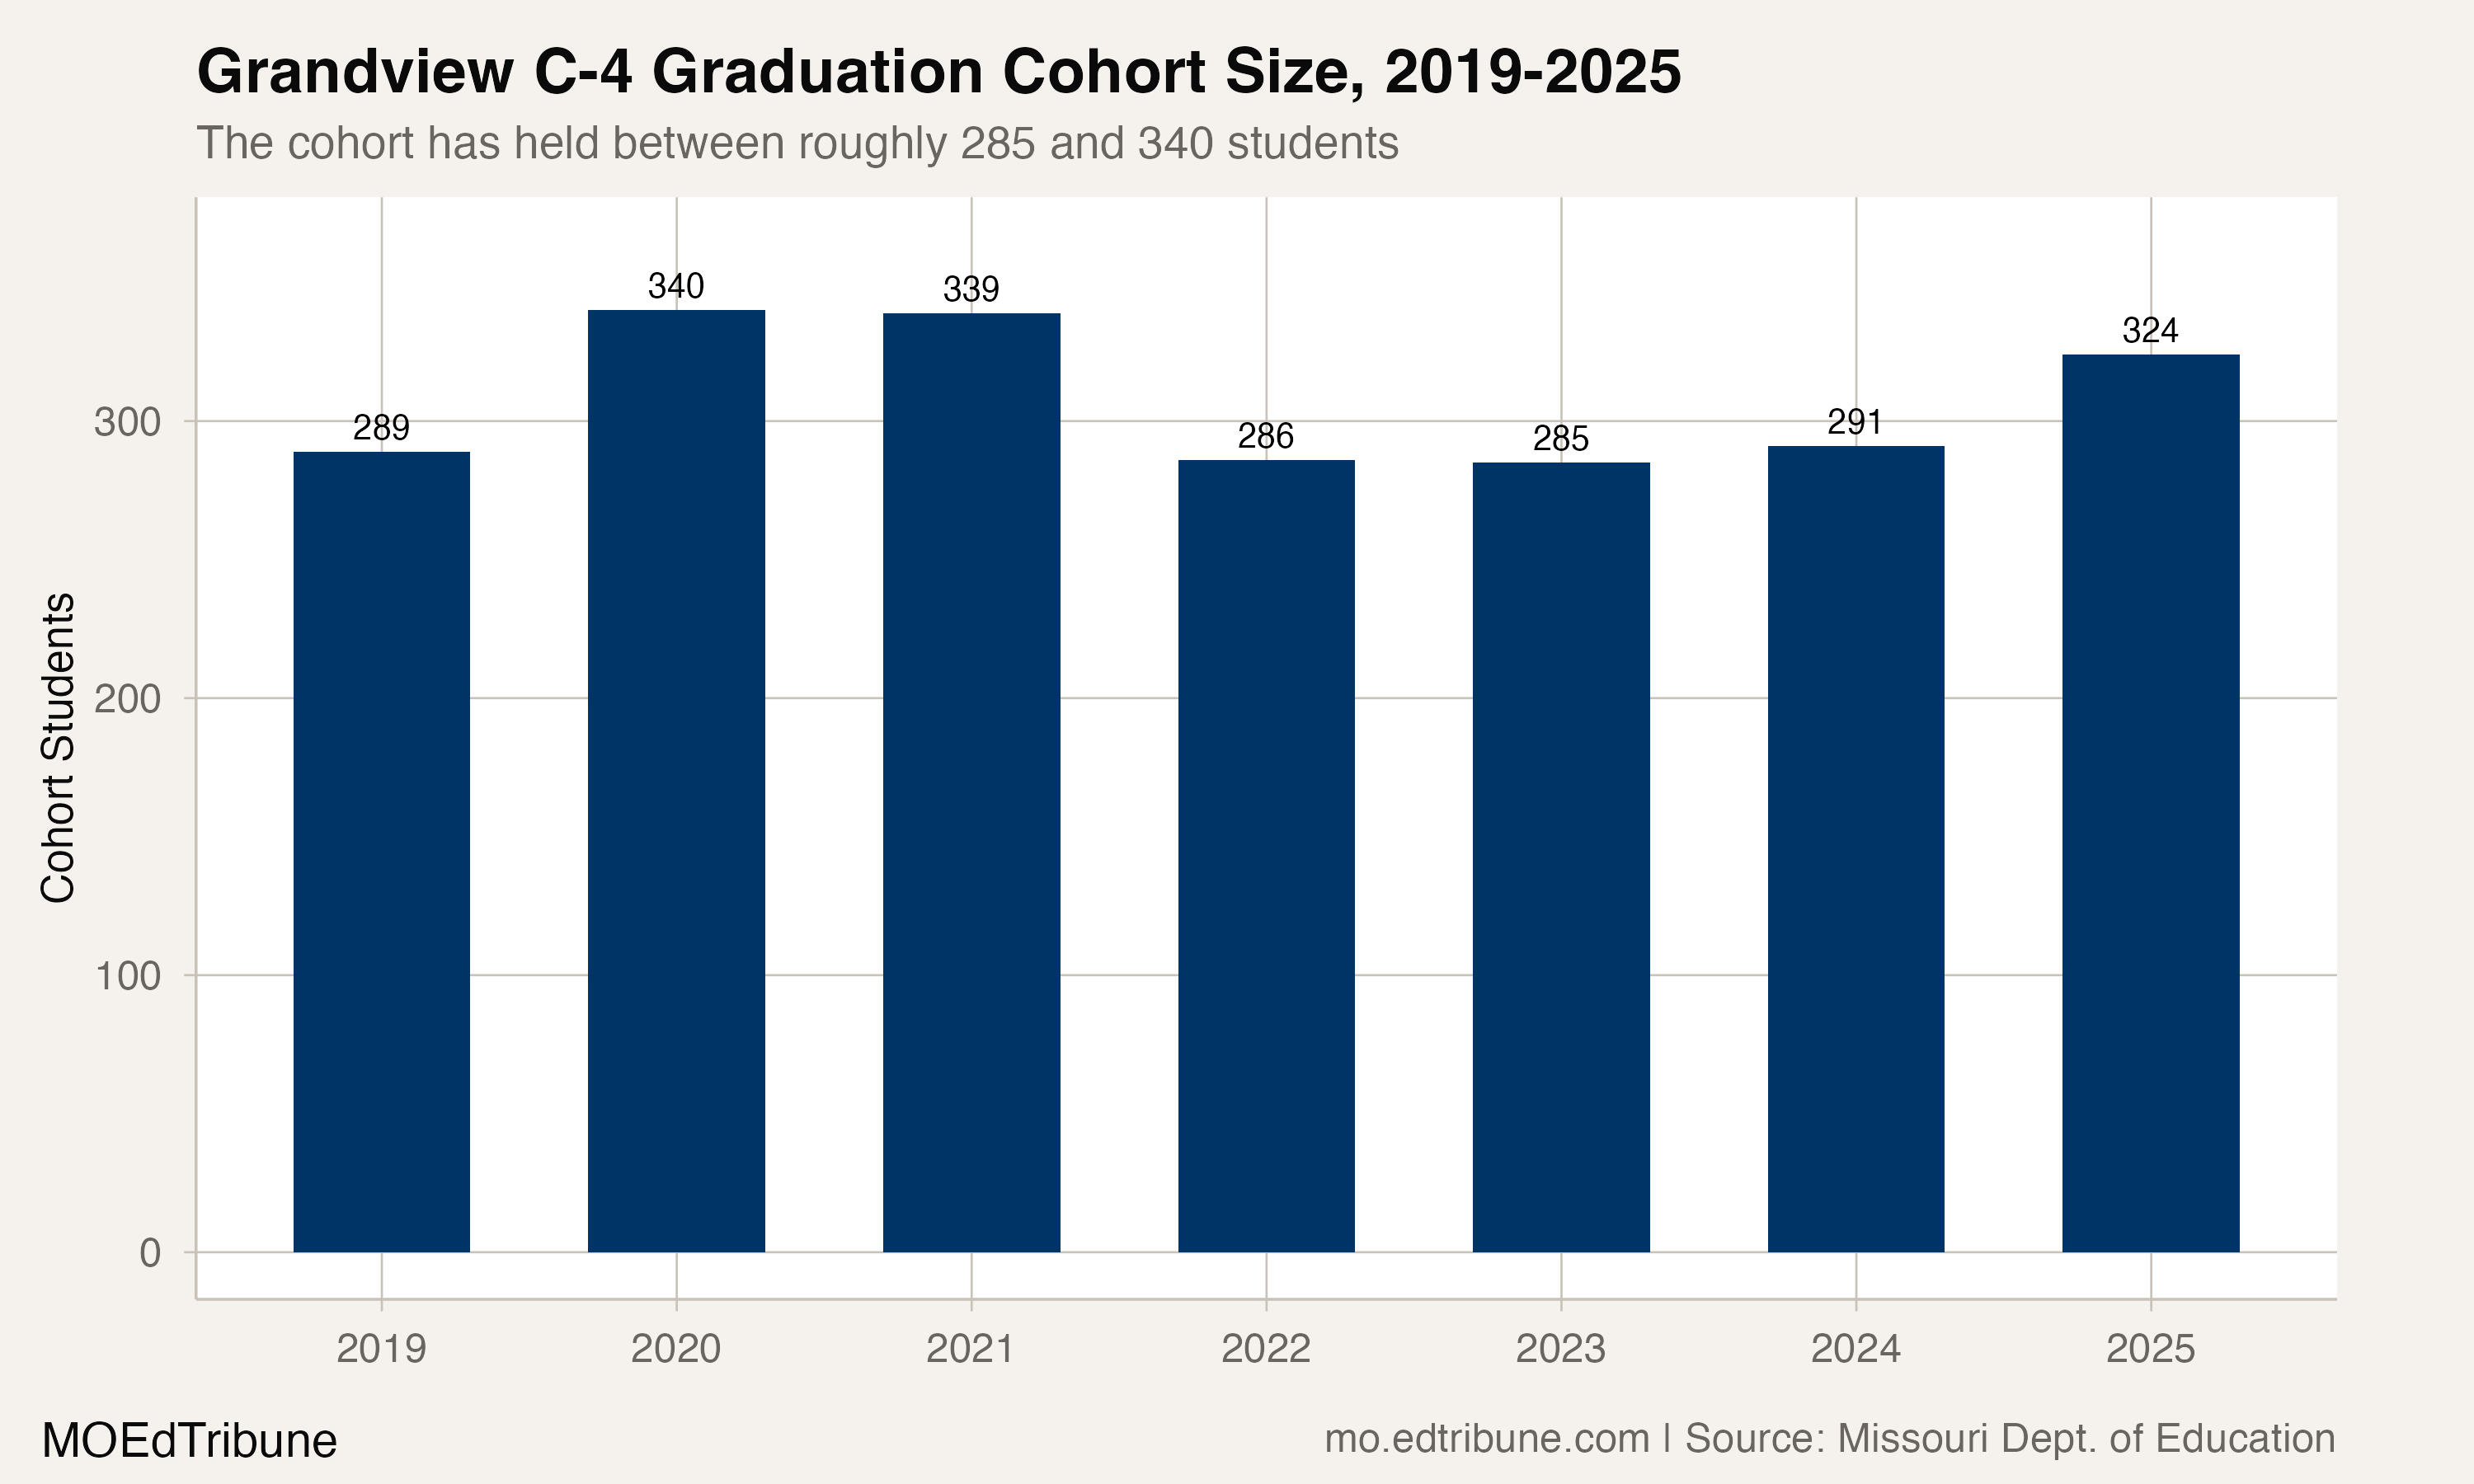
Grandview’s published 2024-25 adjusted cohort contained 324 students. Of those, 235 graduated within the four-year window and 89 did not. The denominator describes the adjusted cohort used to calculate the rate; it is not the number who attended a graduation ceremony.
The district’s published cohort counts ranged from 285 to 340 across the available years. Changes in cohort size and composition can matter when interpreting rates. Those counts alone do not demonstrate statistical stability, random variation or a systemic cause.
What the comparison establishes
The repeated decline and widening endpoint gap are visible in the published results. They support questions about what changed for the cohorts involved. They do not identify why it changed or show that any one event, intervention or district practice caused the pattern.
The state’s adjusted-cohort files supply outcomes and denominators for this comparison. They do not establish individual students’ reasons for not completing within the four-year window. An explanation would require additional evidence beyond the rate sequence.
Detailed code that reproduces the analysis and figures in this article is available exclusively to EdTribune subscribers.
Discussion
Sign in to join the discussion.
Loading comments...