Correction (October 8, 2026): The improvement ranking now follows stable district IDs across name changes, adding an eligible subgroup to the comparison. The leading result is unchanged. The rate-baseline comparison is now expressly hypothetical.
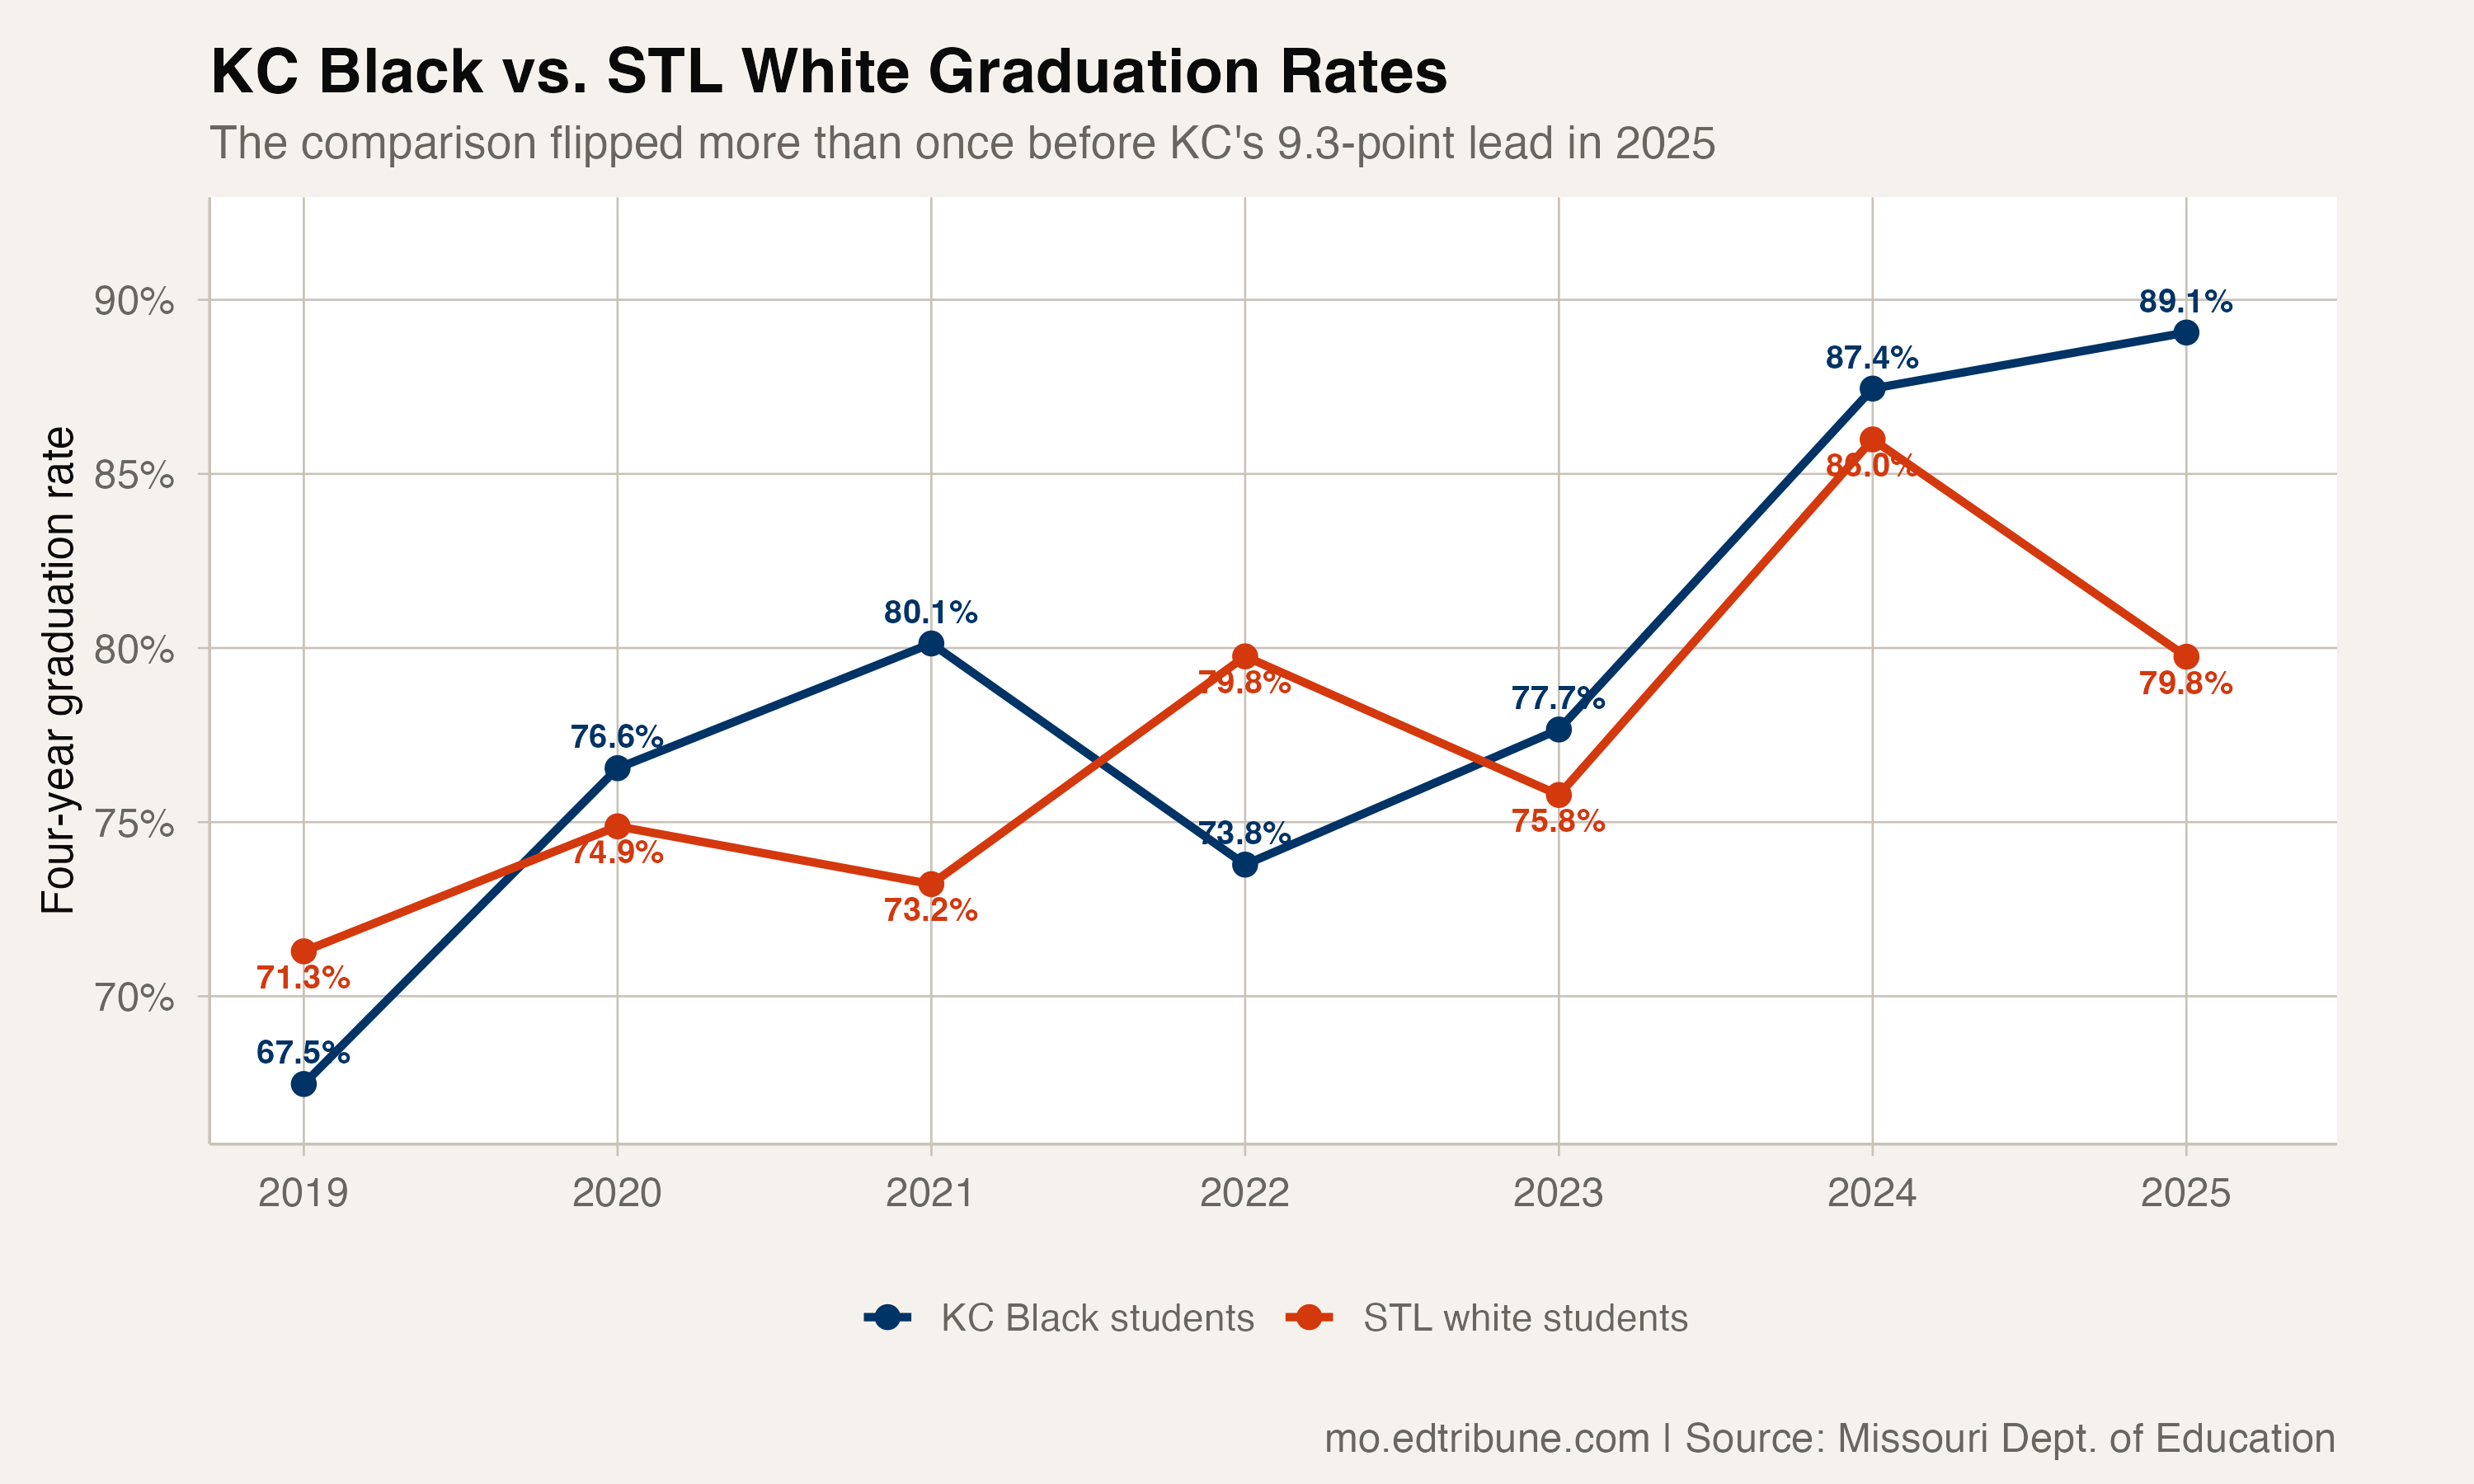
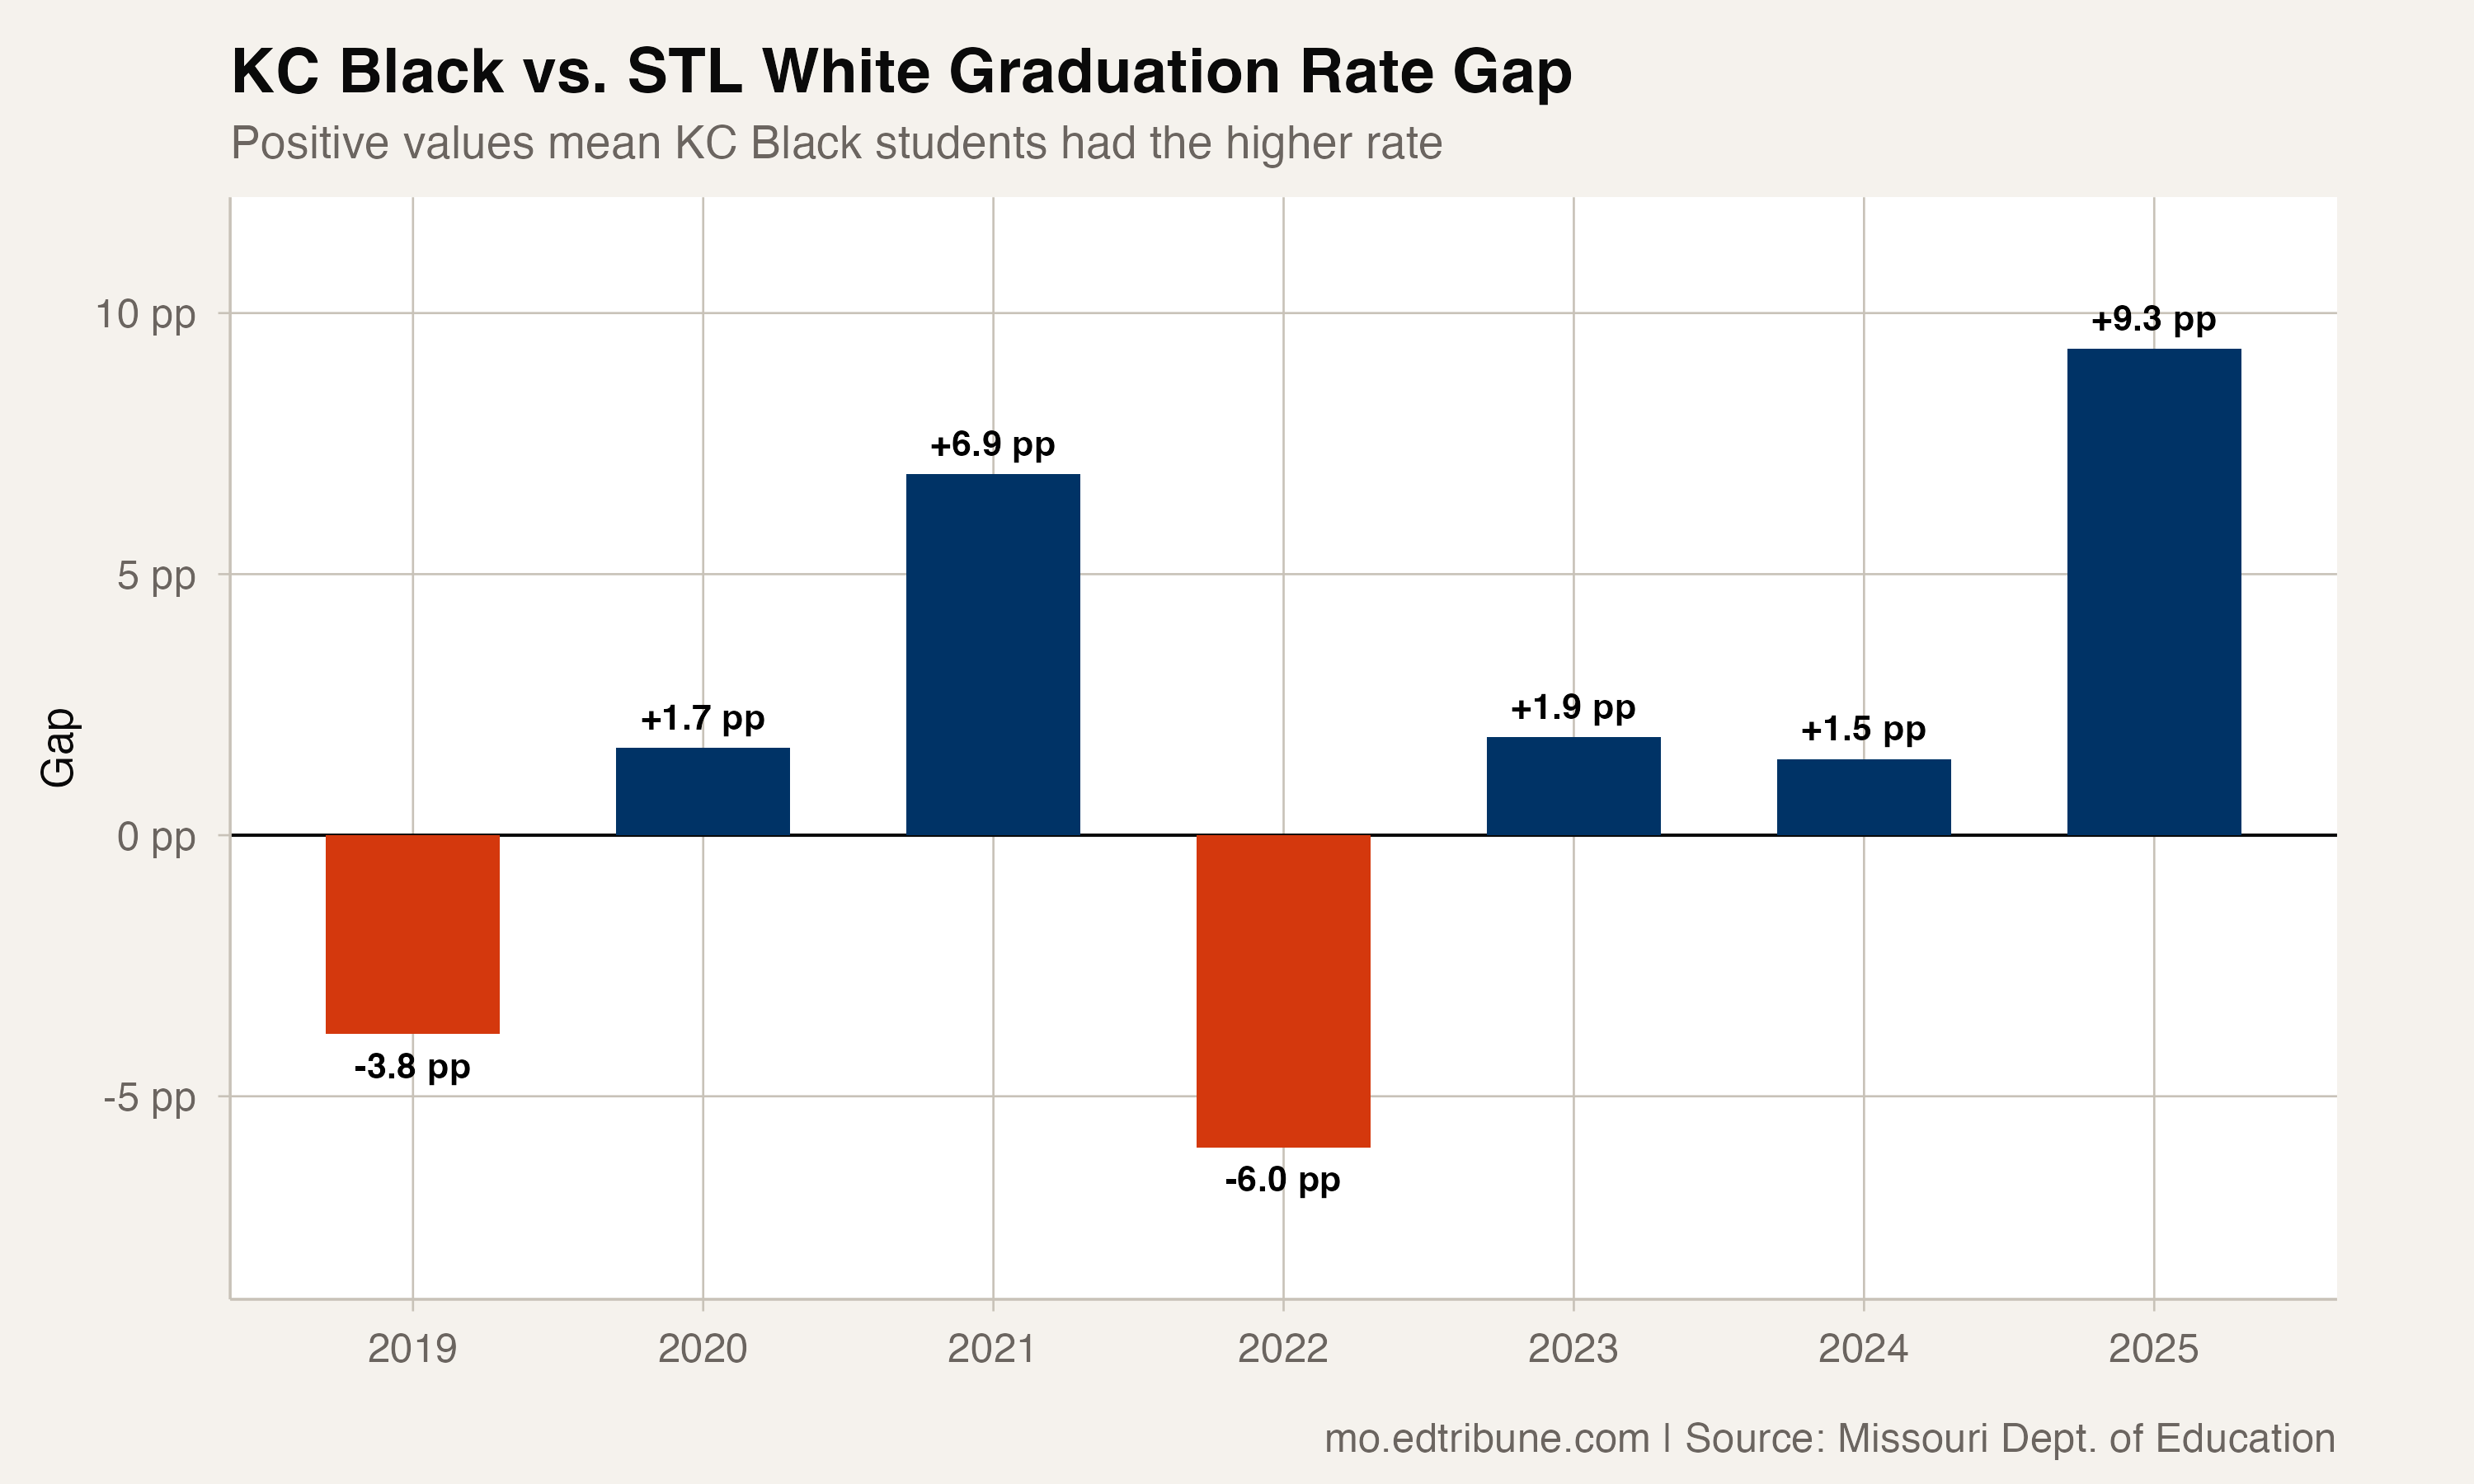
Black students in Kansas City 33↗ET had a published four-year graduation rate of 89.1% in 2024-25. White students in St. Louis City↗ET had a rate of 79.8%. The difference was 9.3 percentage points in Kansas City’s favor.
At the beginning of the available comparison, in 2018-19, the Kansas City Black rate was 67.5% and the St. Louis White rate was 71.3%. St. Louis led by 3.8 points. The comparison first flipped in 2019-20, moved back to St. Louis in 2021-22, then returned to Kansas City in 2022-23. Kansas City’s largest lead in this observed window came in its final year.
The endpoint change
Kansas City’s Black graduation rate rose by 21.6 percentage points between 2018-19 and 2024-25. Among the 152 Missouri district race-subgroup comparisons with reported endpoint rates and at least 100 students in both adjusted cohorts, that was the largest increase. The comparison follows district IDs across name changes. St. Louis’s White rate rose by 8.5 points over the same endpoints.
Kansas City’s Black adjusted cohort was smaller in the final year: 585 students, compared with 695 at the beginning. Published graduate counts moved in the other direction, from 469 to 521. Those are distinct cohorts, and the change does not establish what happened to the same students over time.
Applying the earlier rate to the final cohort would imply about 395 graduates. The reported final count was 126 above that hypothetical comparison. That difference describes a rate scenario; it is not an estimate of graduates attributable to a particular policy or intervention.
Both racial groups in both cities
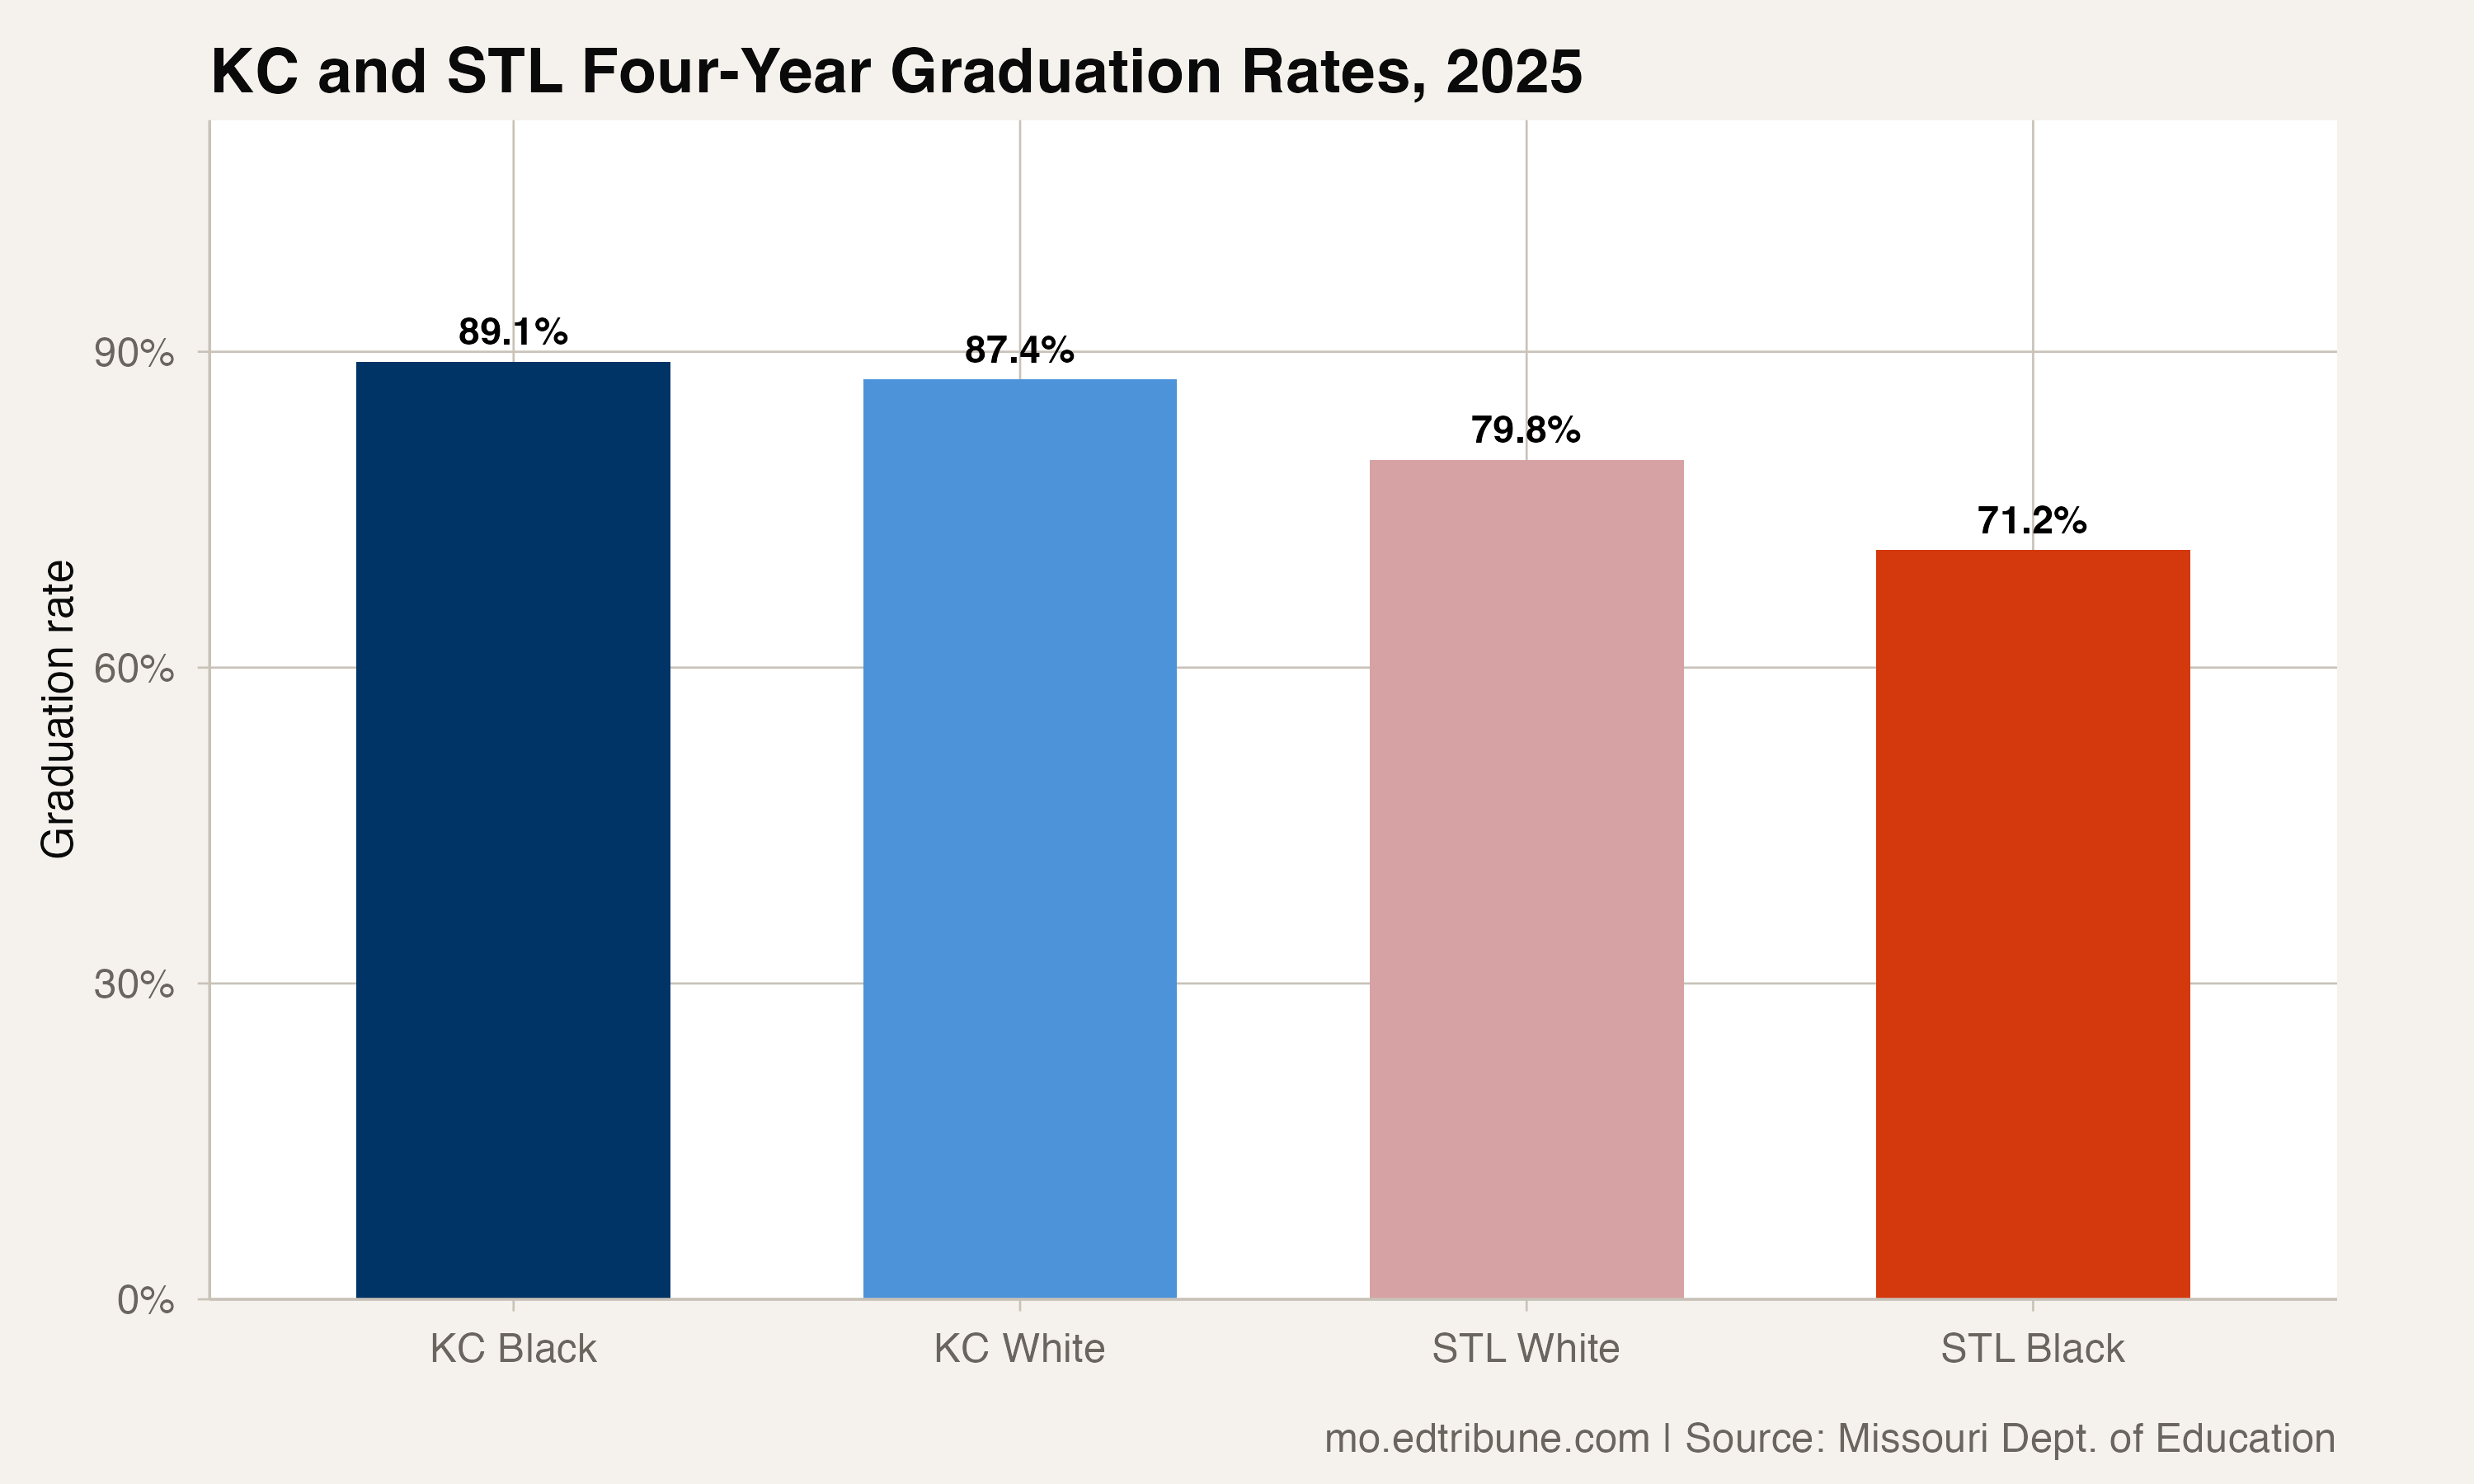
The published four-year rates for 2024-25 were:
- Kansas City Black students: 89.1%
- Kansas City White students: 87.4%
- St. Louis White students: 79.8%
- St. Louis Black students: 71.2%
Kansas City’s Black rate exceeded its White rate by 1.7 points. Among the 29 Missouri districts with at least 50 Black students and 50 White students in their final adjusted cohorts, Kansas City was one of nine where the Black rate was higher.
St. Louis City’s overall rate was 70.3%, which was 22.4 points below Missouri’s 92.7% state rate. Its Black rate was 0.7 points below its own rate at the beginning of the window.
What the comparison establishes
Kansas City had a smaller Black adjusted cohort but 52 more Black graduates at the final endpoint. The rate improvement and count change are both visible in the published records. They do not identify the policies, staffing changes, attendance changes or school-level interventions that caused the improvement.
The cross-city comparison also joins different racial groups in different districts. It can describe how their published rates changed relative to each other. It does not measure the effect of attending one district rather than the other or account for differences in the students represented by each cohort.
Detailed code that reproduces the analysis and figures in this article is available exclusively to EdTribune subscribers.
Discussion
Sign in to join the discussion.
Loading comments...