Correction (October 8, 2026): An earlier version called the Black graduation-rate gain the largest while reporting a larger multiracial gain. It also treated similar White and Hispanic endpoint gains as annual lockstep and attributed statewide changes to particular local mechanisms without testing them. Those statements have been corrected. The Asian-White difference and final spread are now reported at their computed precision. The hypothetical completion comparison now applies explicitly to the reported cohort, rather than to every year.
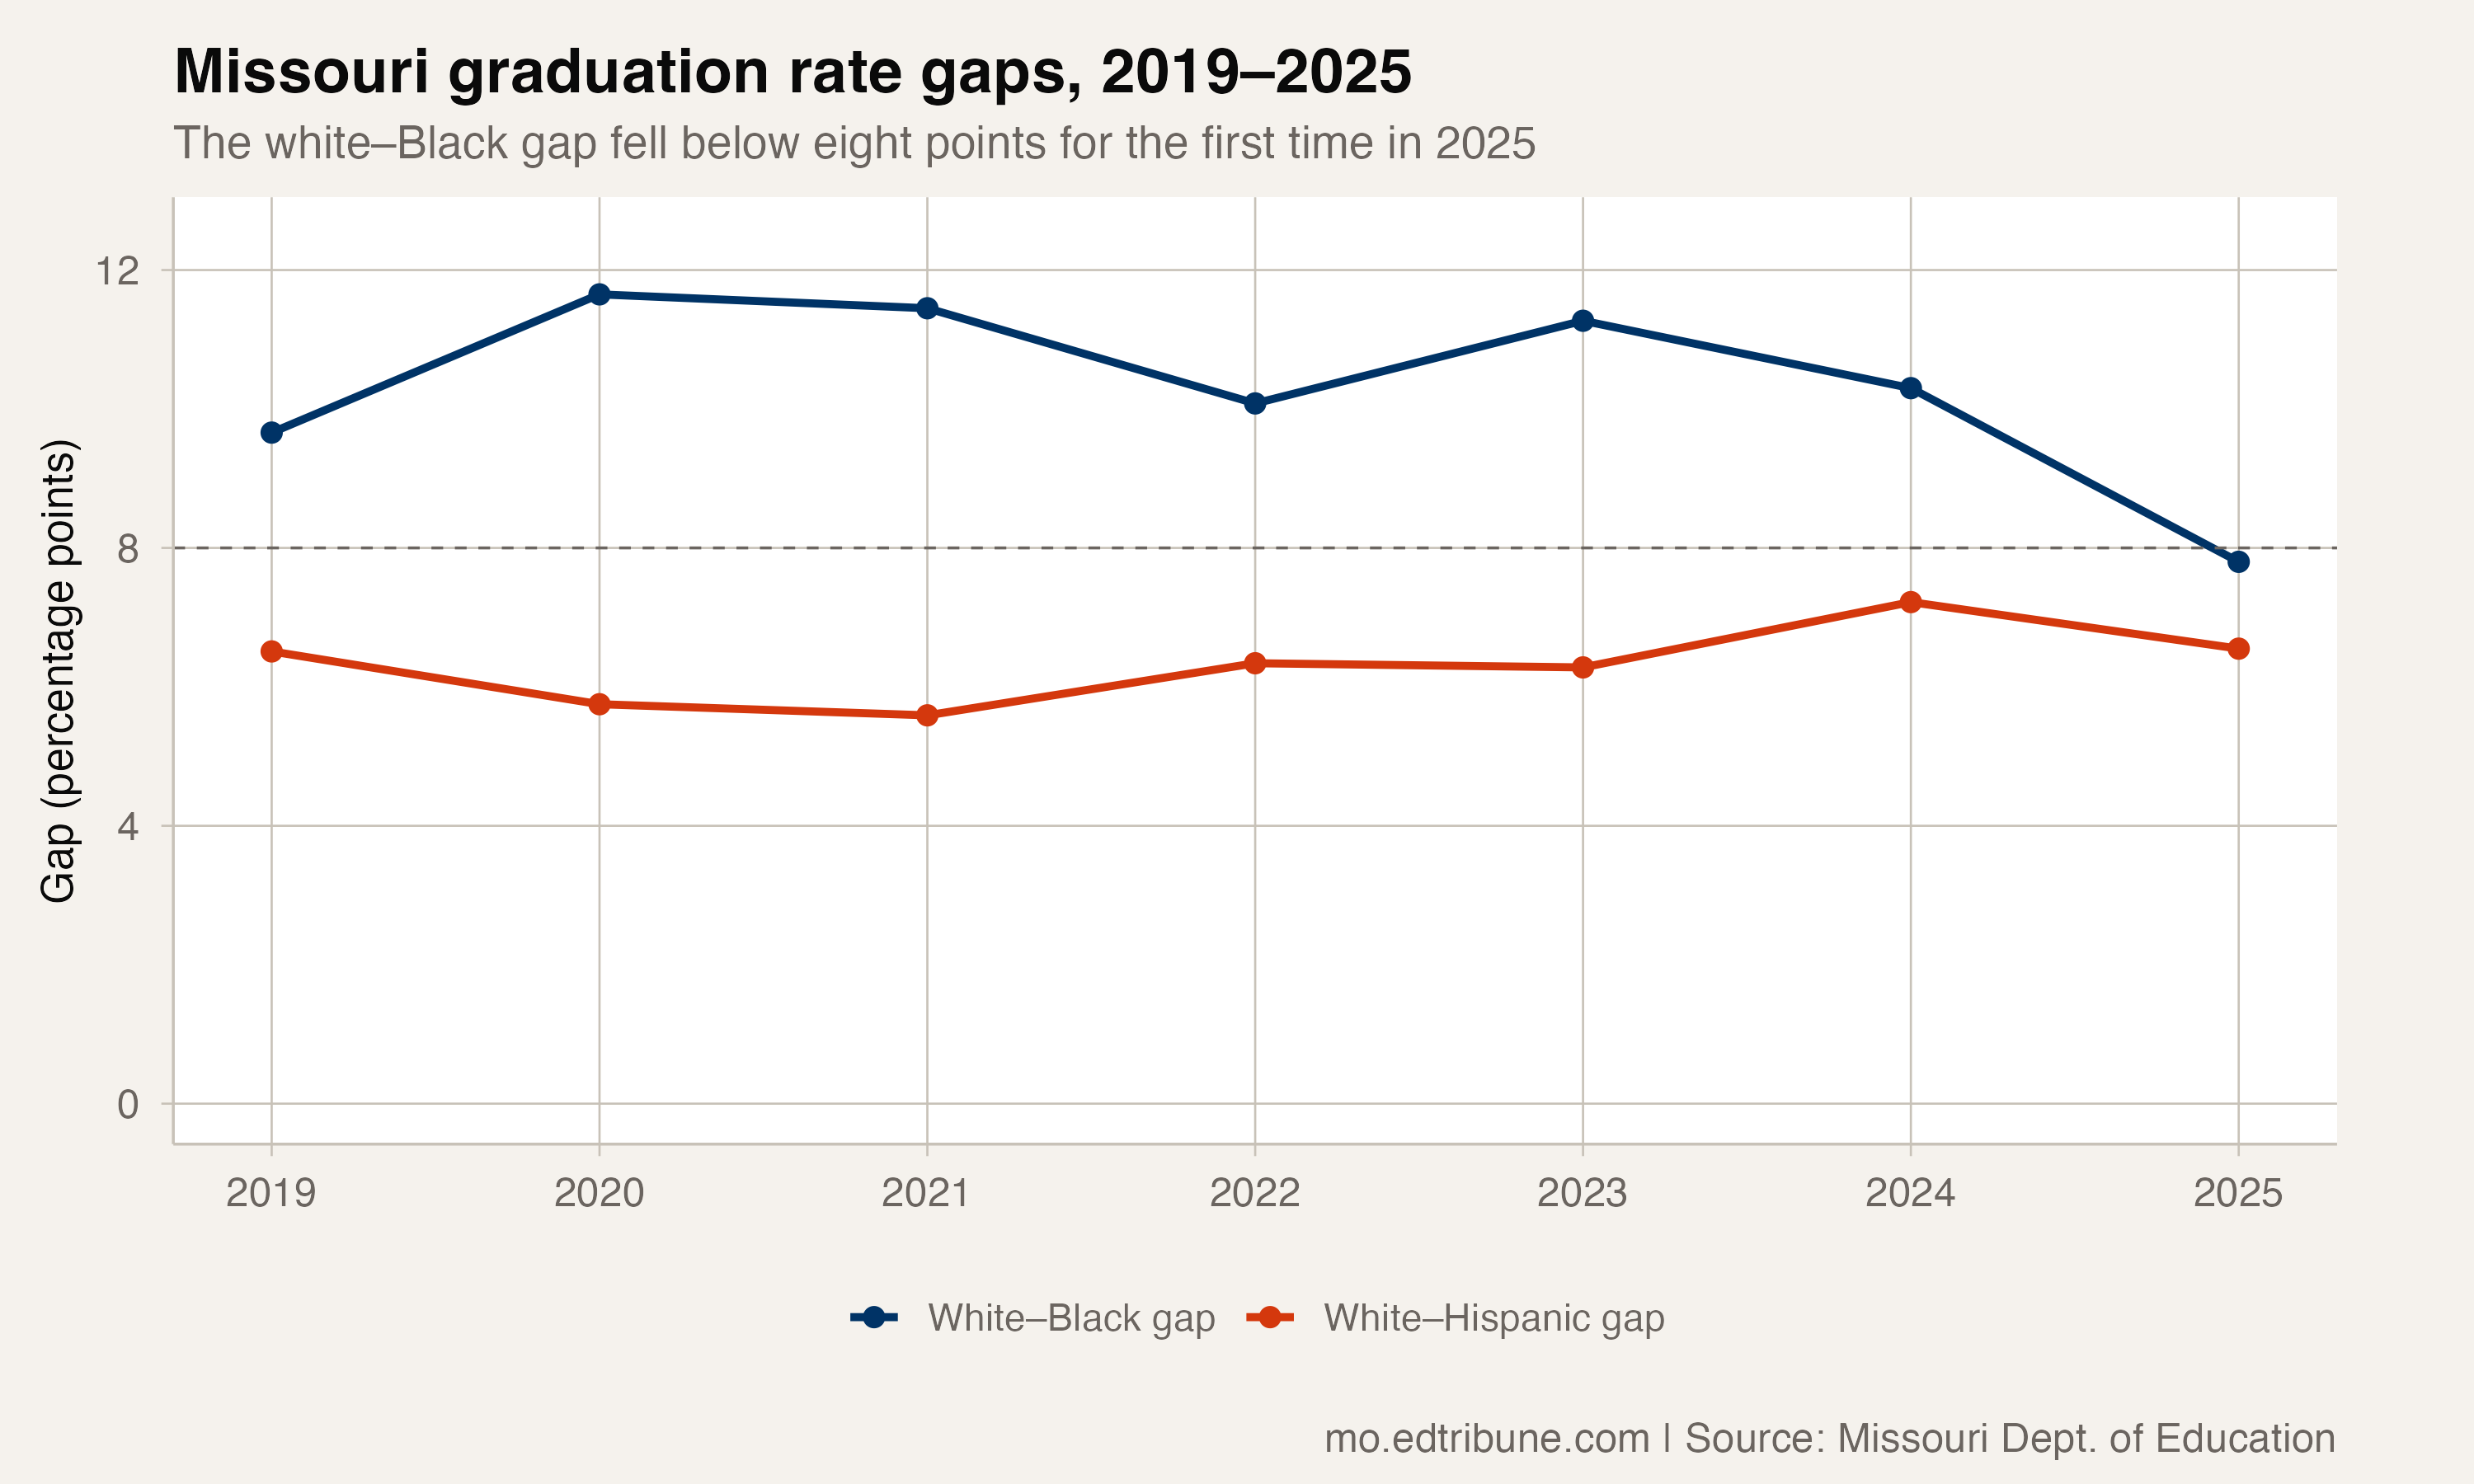
For the first time in the available 2018-19 through 2024-25 data, Missouri’s White-Black four-year graduation-rate gap fell below eight percentage points. In 2024-25, the published rates were 94.5% for White students and 86.7% for Black students, a difference of 7.8 points. The gap was 9.7 points at the start of the window.
Black students’ rate increased by 3.41 percentage points between those endpoints, more than double the White rate’s 1.55-point increase. The Black rate at the end of the window was its highest in this series. Those comparisons establish the size and timing of the change; they do not identify its cause.
Similar Hispanic endpoint gaps
The White-Hispanic gap rounded to 6.5 points at both endpoints. White students’ rate rose by 1.55 points and Hispanic students’ by 1.51 points. Similar endpoint gains do not mean their rates moved together in every intervening year.
The statewide Hispanic rate ranged from 86.4% to 87.9% over the comparison. A district example moved in the other direction: St. Louis City↗ET reported a Hispanic rate of 51.2% in 2024-25, down 14.6 points from 2018-19. The attendance or other mechanisms behind these graduation results are not identified in this comparison.
The latest rates and the window’s peaks
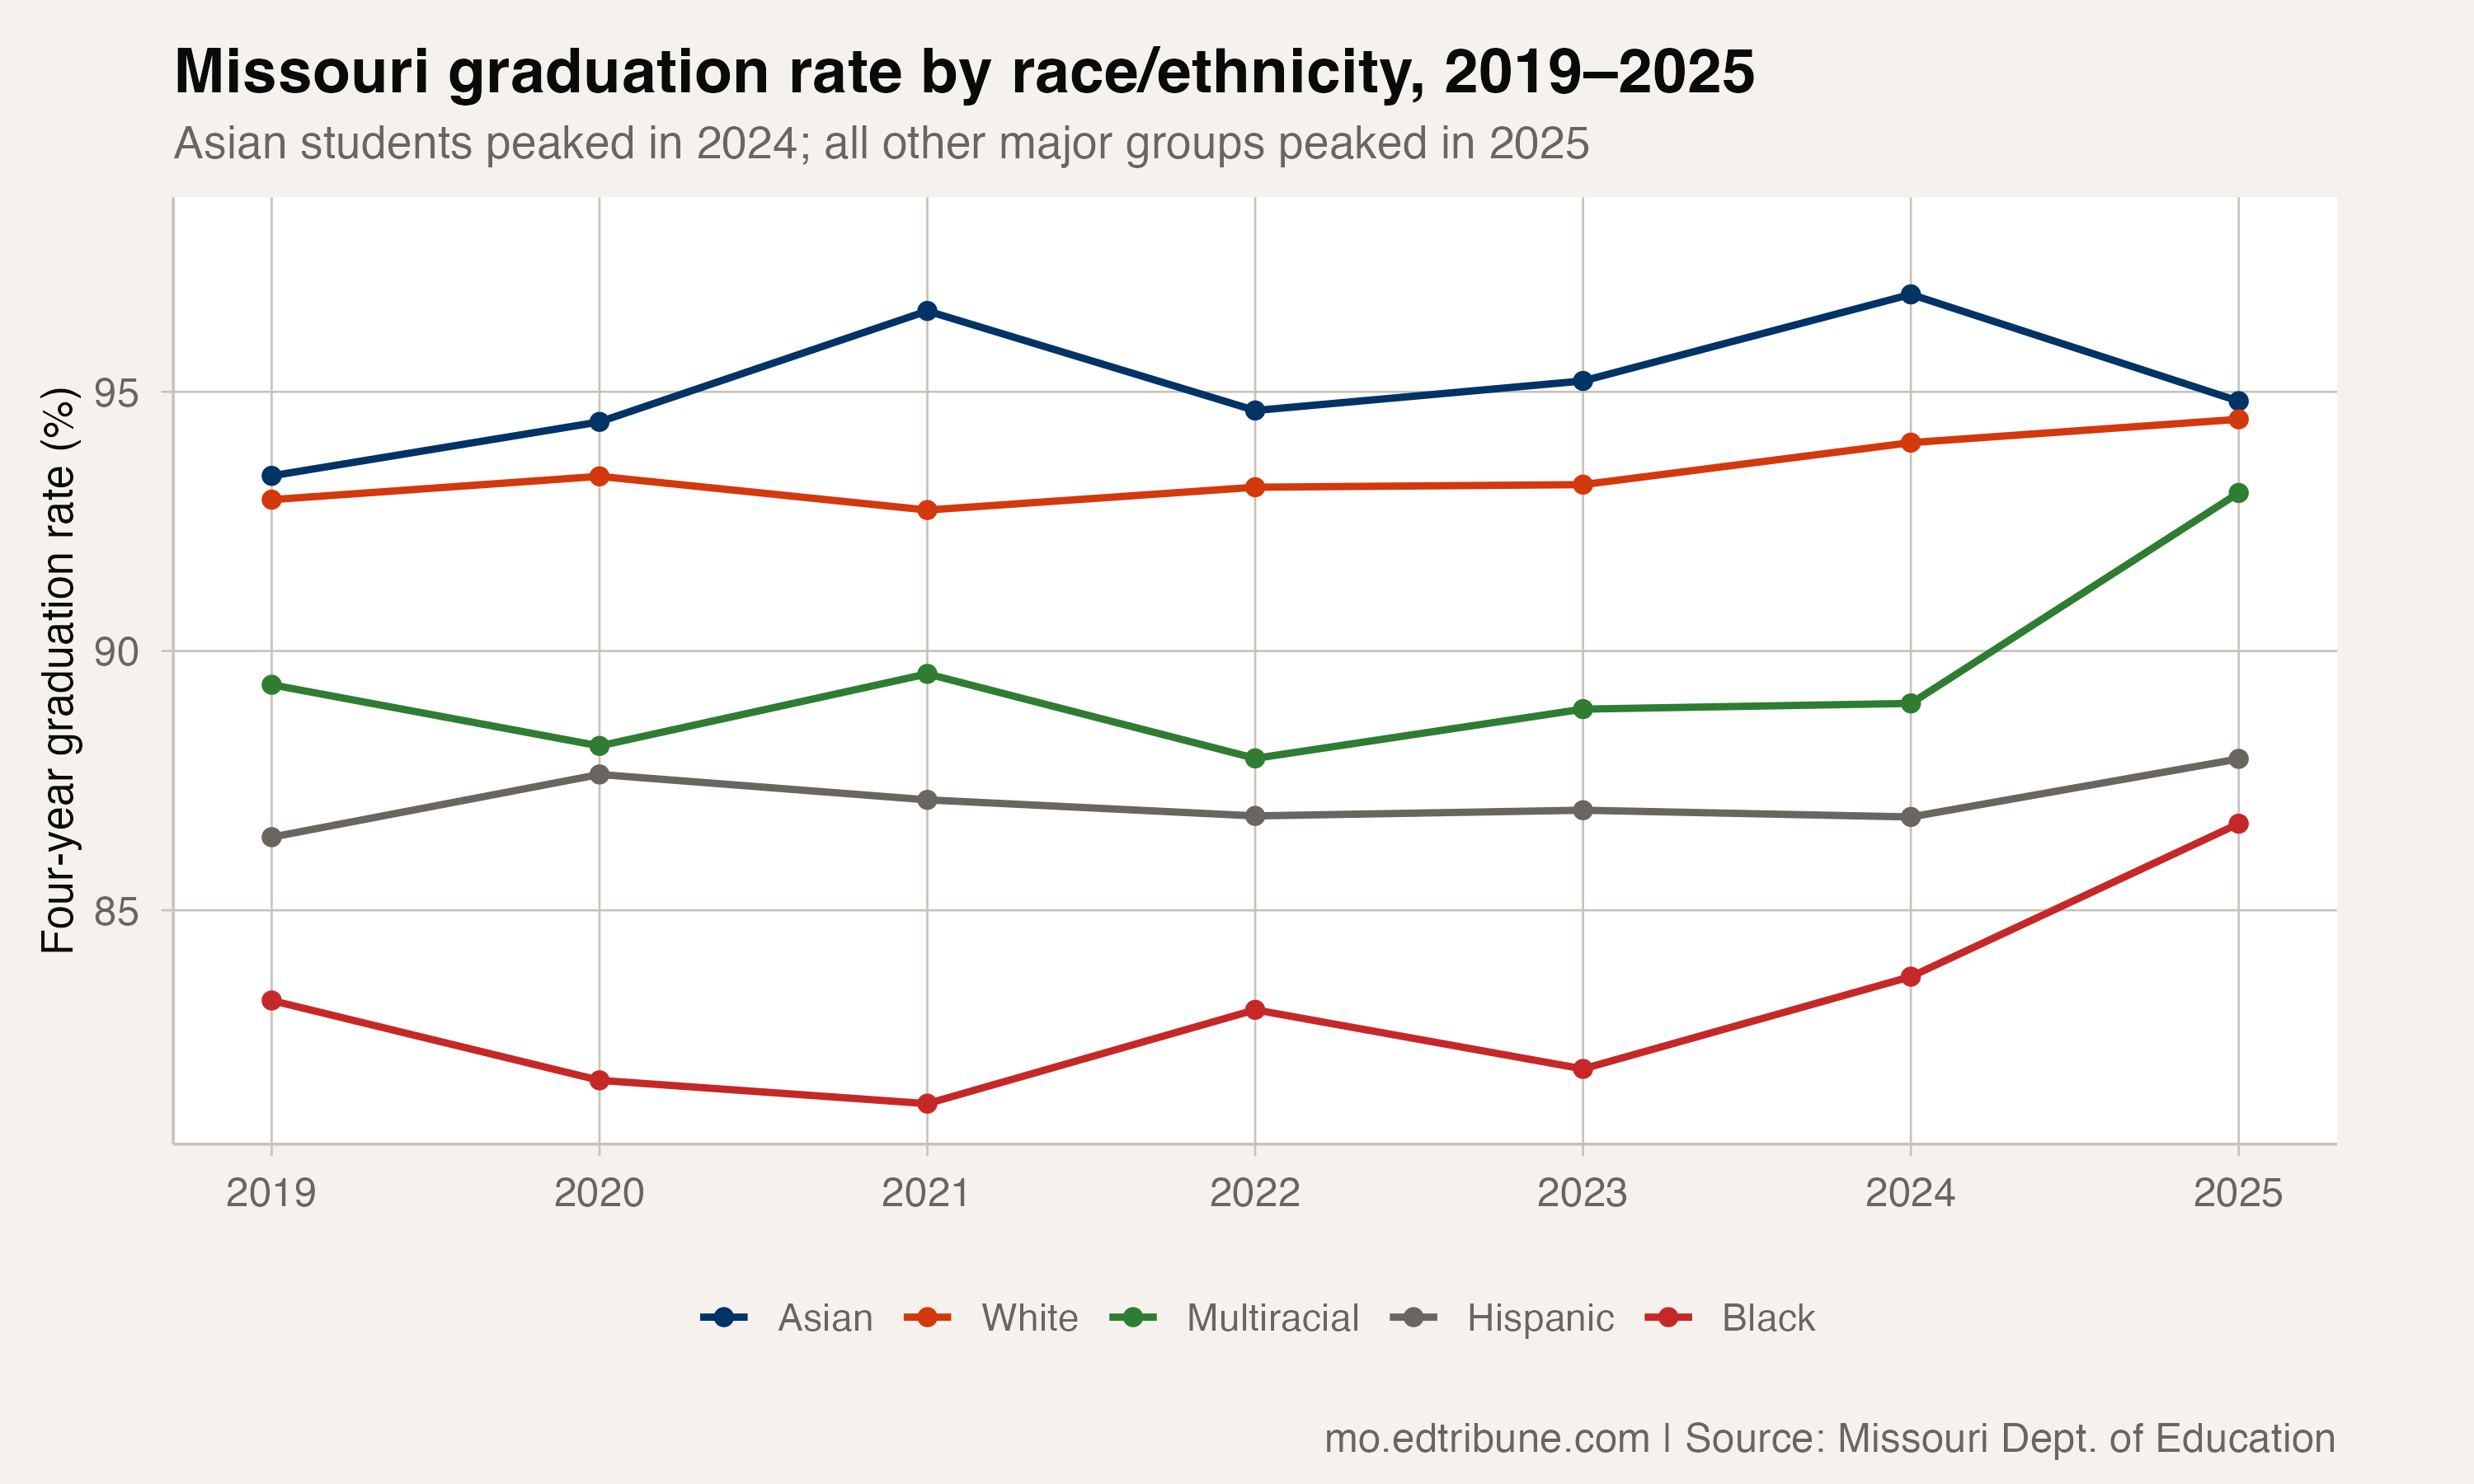
White, multiracial, Hispanic and Black students each recorded their highest published rate in this window in 2024-25. Asian students’ earlier peak was 96.9% in 2023-24, above their 94.8% rate in 2024-25.
The 2024-25 rates were:
- Asian: 94.8%
- White: 94.5%
- Multiracial: 93.1%
- Hispanic: 87.9%
- Black: 86.7%
Asian and White rates differed by 0.35 points. The White-multiracial gap narrowed from 3.6 points to 1.4 points between the window’s endpoints.
Gains differed by group
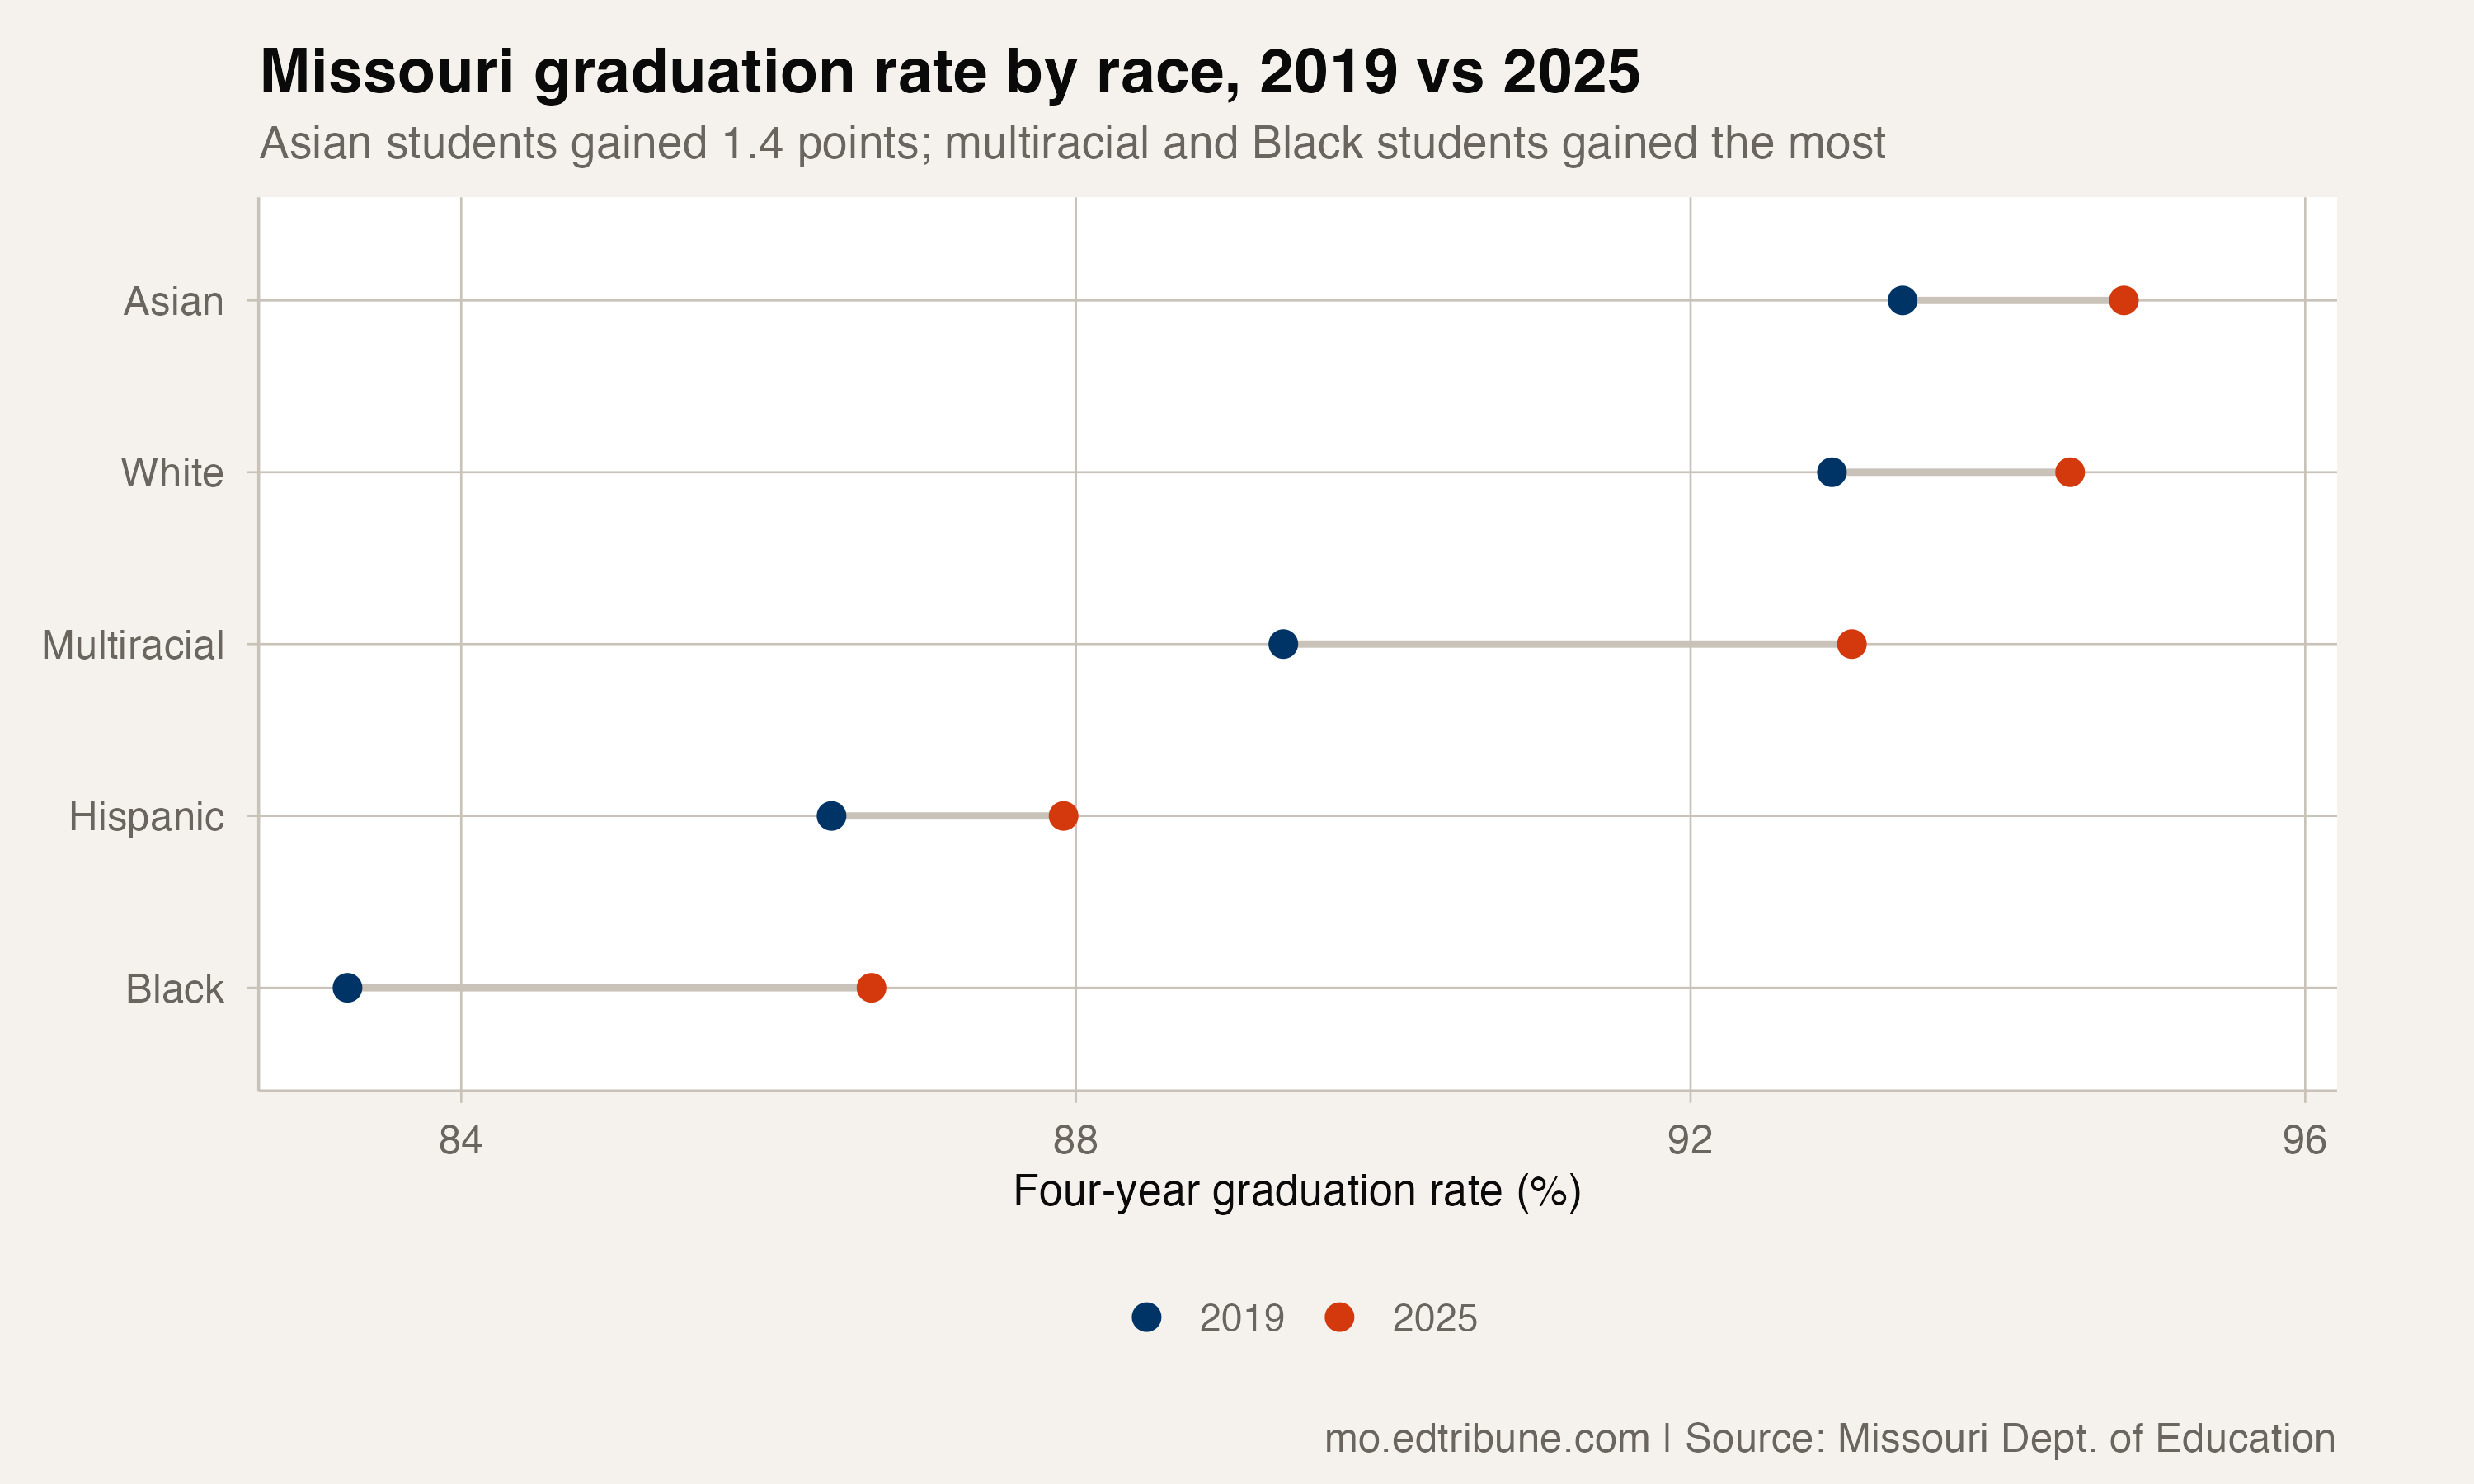
Multiracial students had the largest endpoint gain among these groups, at 3.70 points. Black students gained 3.41 points, White students 1.55 points, Hispanic students 1.51 points and Asian students 1.44 points.
The spread between the highest and lowest of these groups narrowed from 10.1 points to 8.15 points. In 2024-25, those endpoints were the Asian and Black rates.
A remaining difference
The 86.7% Black graduation rate means 13.3% of that adjusted cohort did not graduate within the four-year window. Its published cohort contained 10,346 students. Applying the White statewide rate to that same denominator would imply roughly 810 more graduates. That is a hypothetical rate comparison, rather than an observed count of students whose outcome was caused by the gap.
Kansas City 33↗ET provides a district example: its Black graduation rate rose by 21.6 points between 2018-19 and 2024-25. That result does not establish how much Kansas City contributed to the statewide change or why the rate improved.
The figures come from the Missouri Department of Elementary and Secondary Education’s school data, using published adjusted-cohort graduation records. All comparisons above stay within the available reporting window.
Detailed code that reproduces the analysis and figures in this article is available exclusively to EdTribune subscribers.
Discussion
Sign in to join the discussion.
Loading comments...