Correction (October 8, 2026): Complete positive native district records now include historical years missing from the earlier comparison. The observed-window comparison contains 510 records, with 197 at their observed minimum. Prior statewide total, kindergarten total and indexed-divergence claims have been withdrawn because suppressed cells prevent a compatible exact statewide aggregate. Published district findings remain supported; historical records describe reported agencies rather than unchanged resident populations.
Grain Valley R-V↗ET reported 4,461 K12 students in preliminary 2025-26, last school year and the most recent year in these files, six fewer than its 2021-22 observed peak. That is close enough to the peak to make the district's long expansion unmistakable. It is not, however, evidence that growth has resumed.
The complete observed district record from 2000-01 through preliminary 2025-26 shows Grain Valley growing every year from 2001 through 2022. Enrollment rose from 1,728 to 4,467 during those 21 consecutive gains, an increase of 2,739 students, or 158.5%.
Among the 510 native district records with complete positive published totals for every year from 2000-01 through preliminary 2025-26, Grain Valley's 21-year run is the longest. The years since that observed peak have been less orderly: enrollment fell by 37 in 2023 and 60 in 2024, rose by 96 in 2025, then fell by five in preliminary 2026 data.
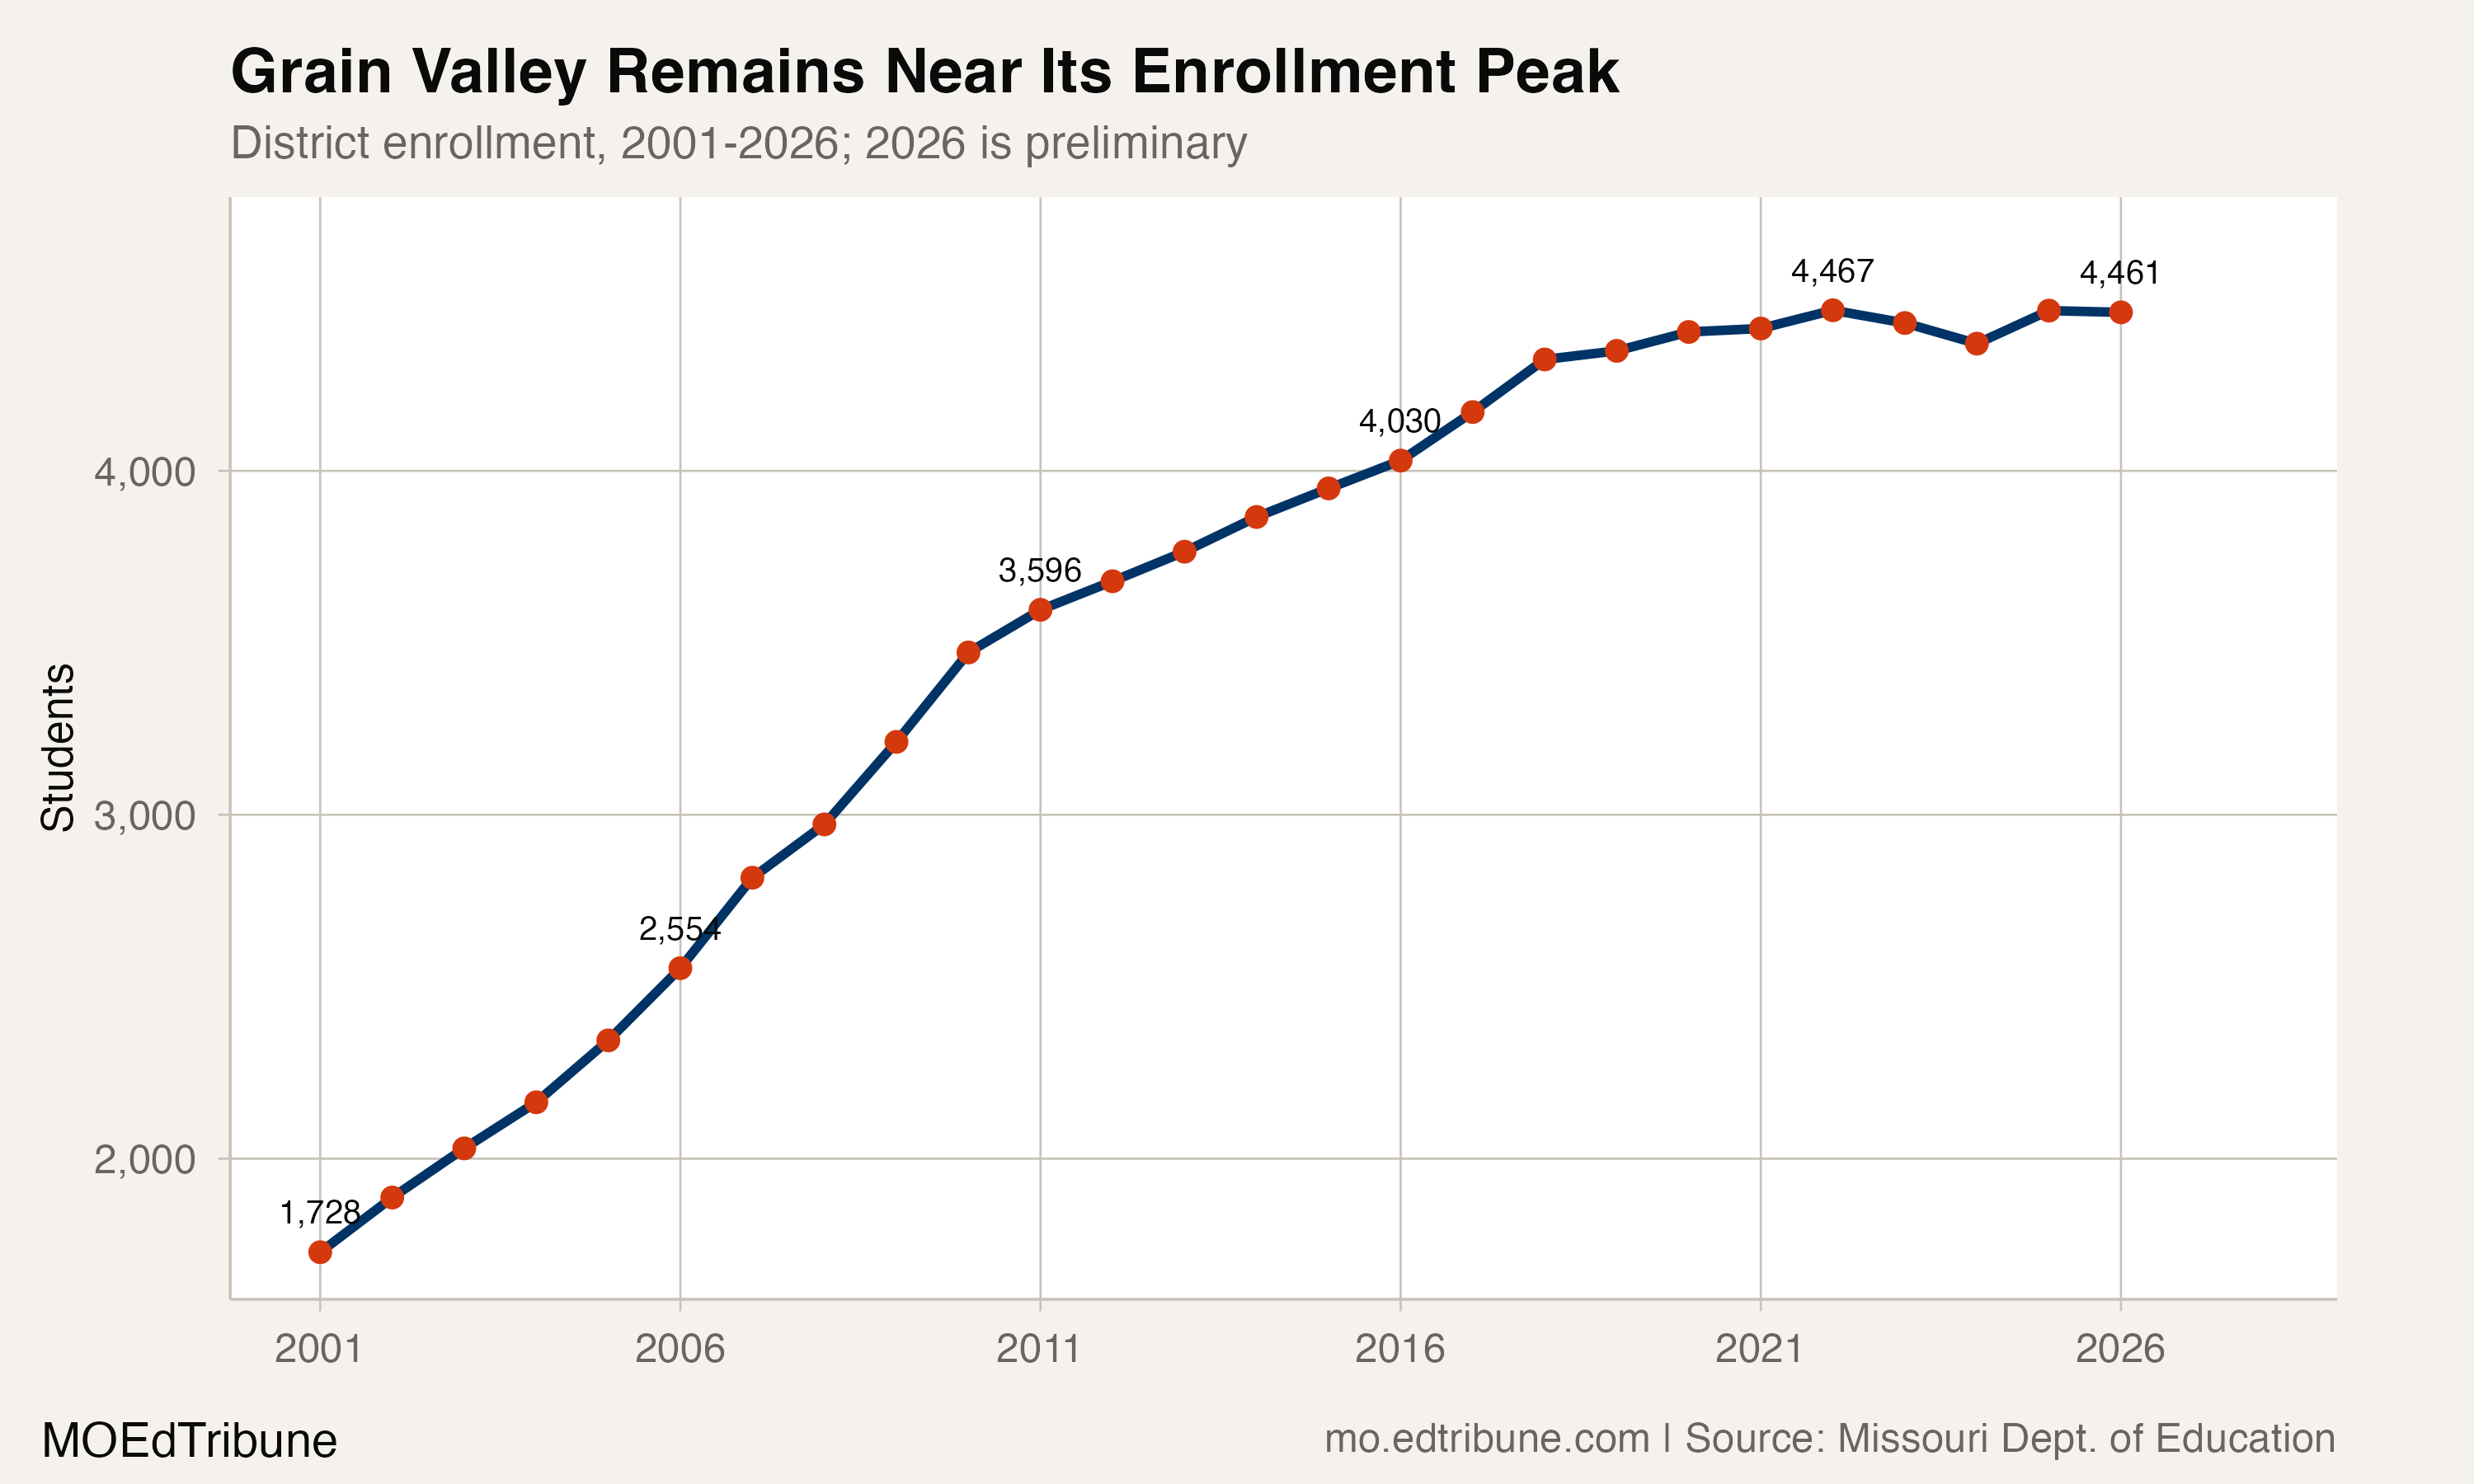
The expansion slowed long before it stopped
Grain Valley's growth came in three distinct phases. From 2001 to 2009, enrollment rose from 1,728 to 3,212, an average increase of 185.5 students for each annual interval. From 2010 to 2018, it rose from 3,472 to 4,324, an average of 106.5 per interval. From 2019 to preliminary 2026, it moved from 4,349 to 4,461, an average of 16 per interval.
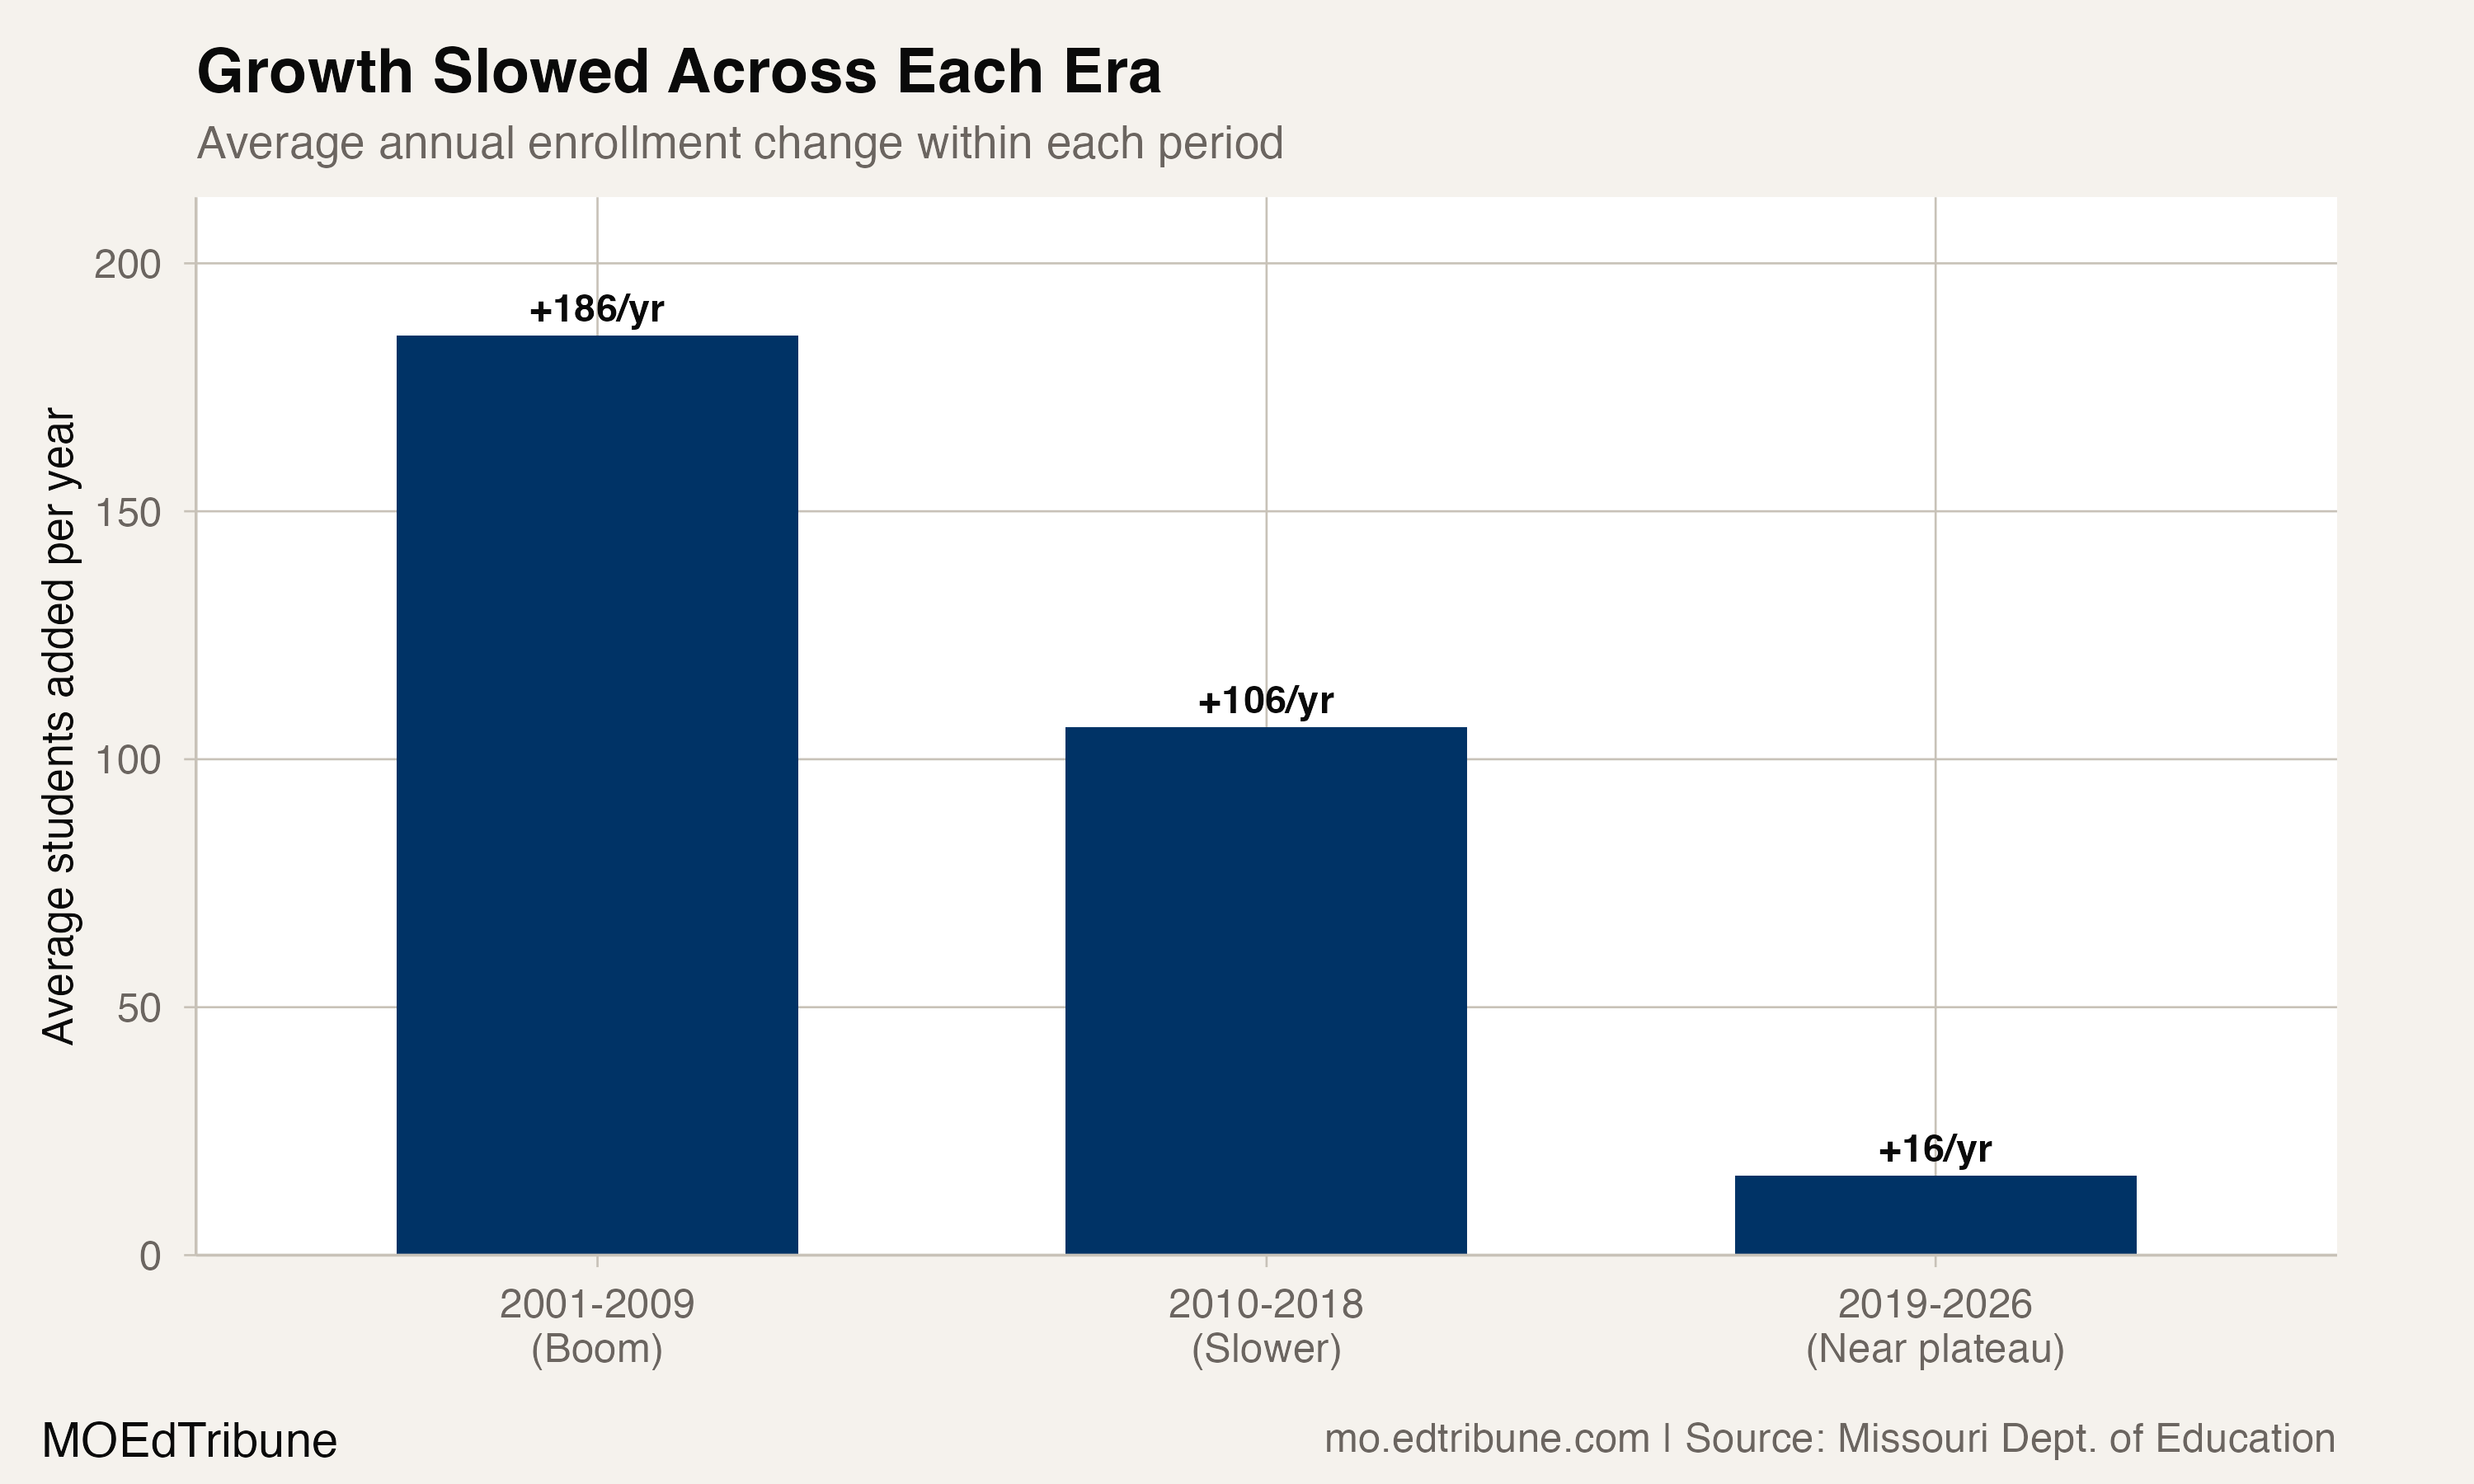
The later period contains both the district's observed peak and its first declines in more than two decades. Grain Valley remains 2,733 students, or 158.2%, above its 2001 count, but its latest four annual changes do not form a continuing rebound.
The city’s historical account describes growth from a farming community alongside housing development. That account offers context for the long enrollment rise, but the enrollment data do not identify housing or development as its cause. City of Grain Valley
Faster than its eastern Jackson County peers
Grain Valley's percentage growth since 2001 is much larger than that of the seven named district records in this comparison. Lee's Summit R-VII↗ET added 3,018 students through preliminary 2026, a 21.3% increase. Independence 30↗ET grew 18.9%, Blue Springs R-IV↗ET grew 13.9%, and Fort Osage R-I↗ET declined 6.4%.
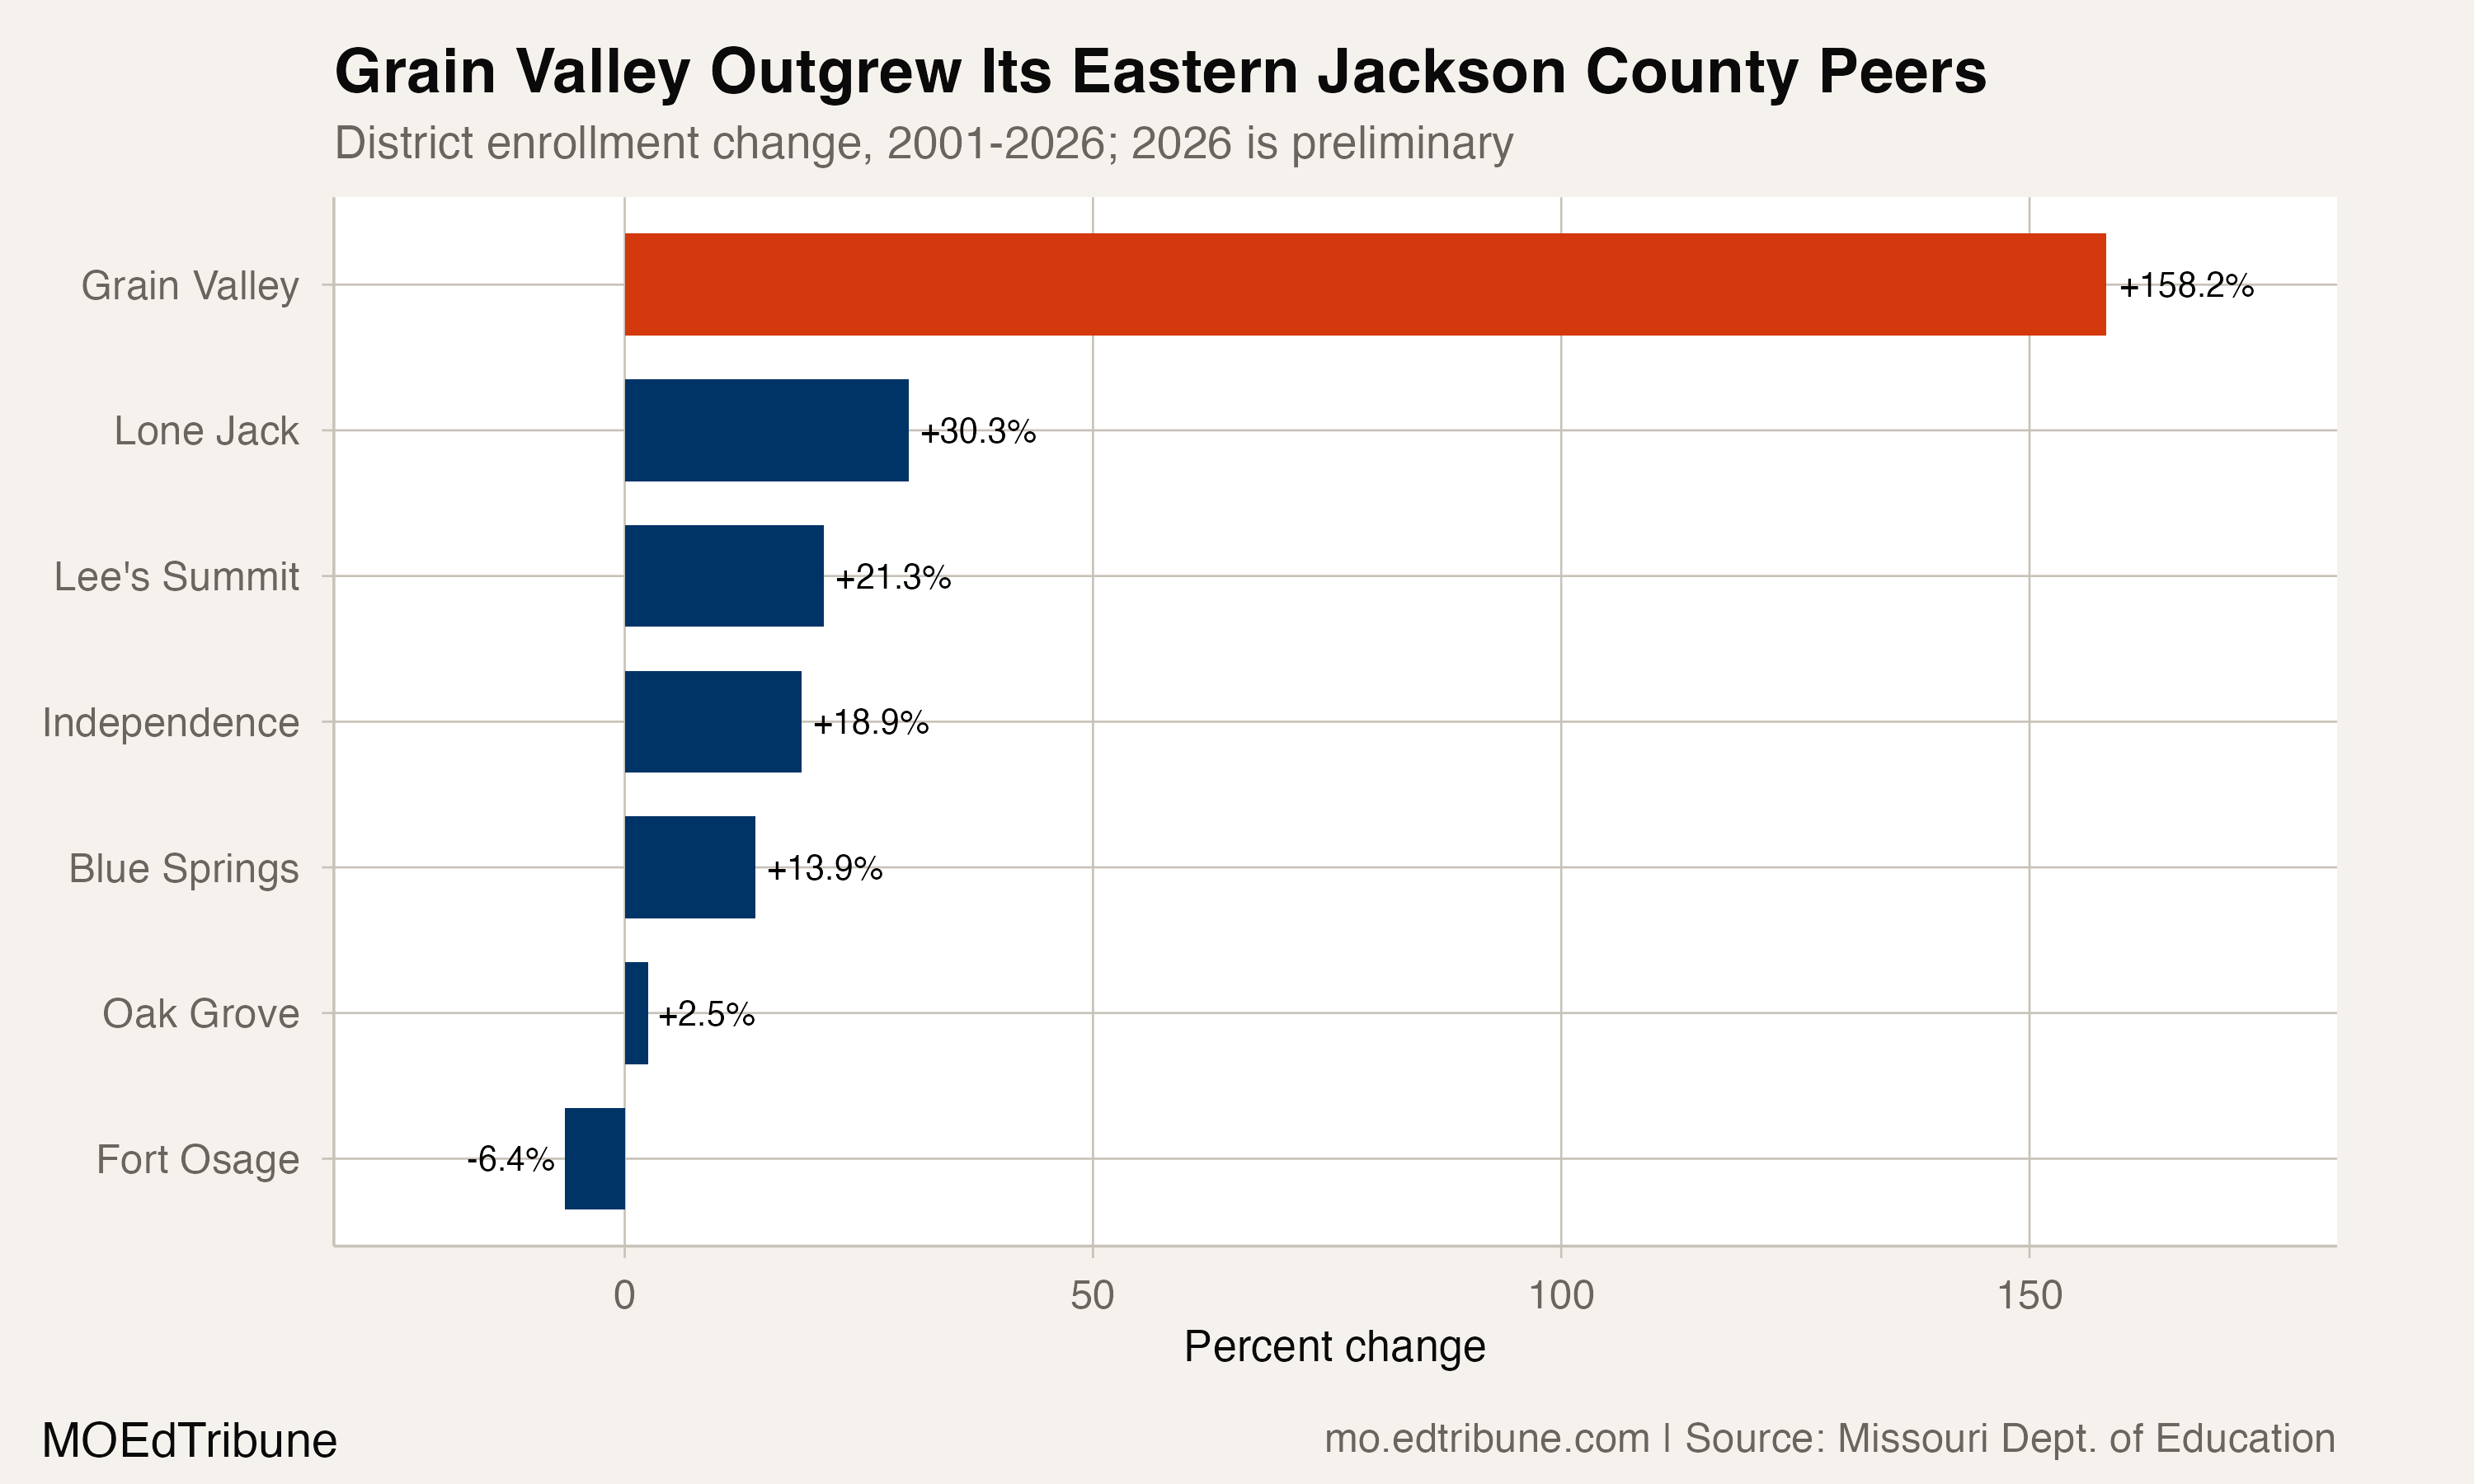
Grain Valley ranks fifth for percentage growth among native district records with published positive totals at both endpoints and at least 500 students in 2000-01. Four districts grew faster on that measure. The enrollment file does not establish why their growth differed, so the comparison should not be read as a ranking of housing-driven or in-person growth.
A high plateau in the observed record
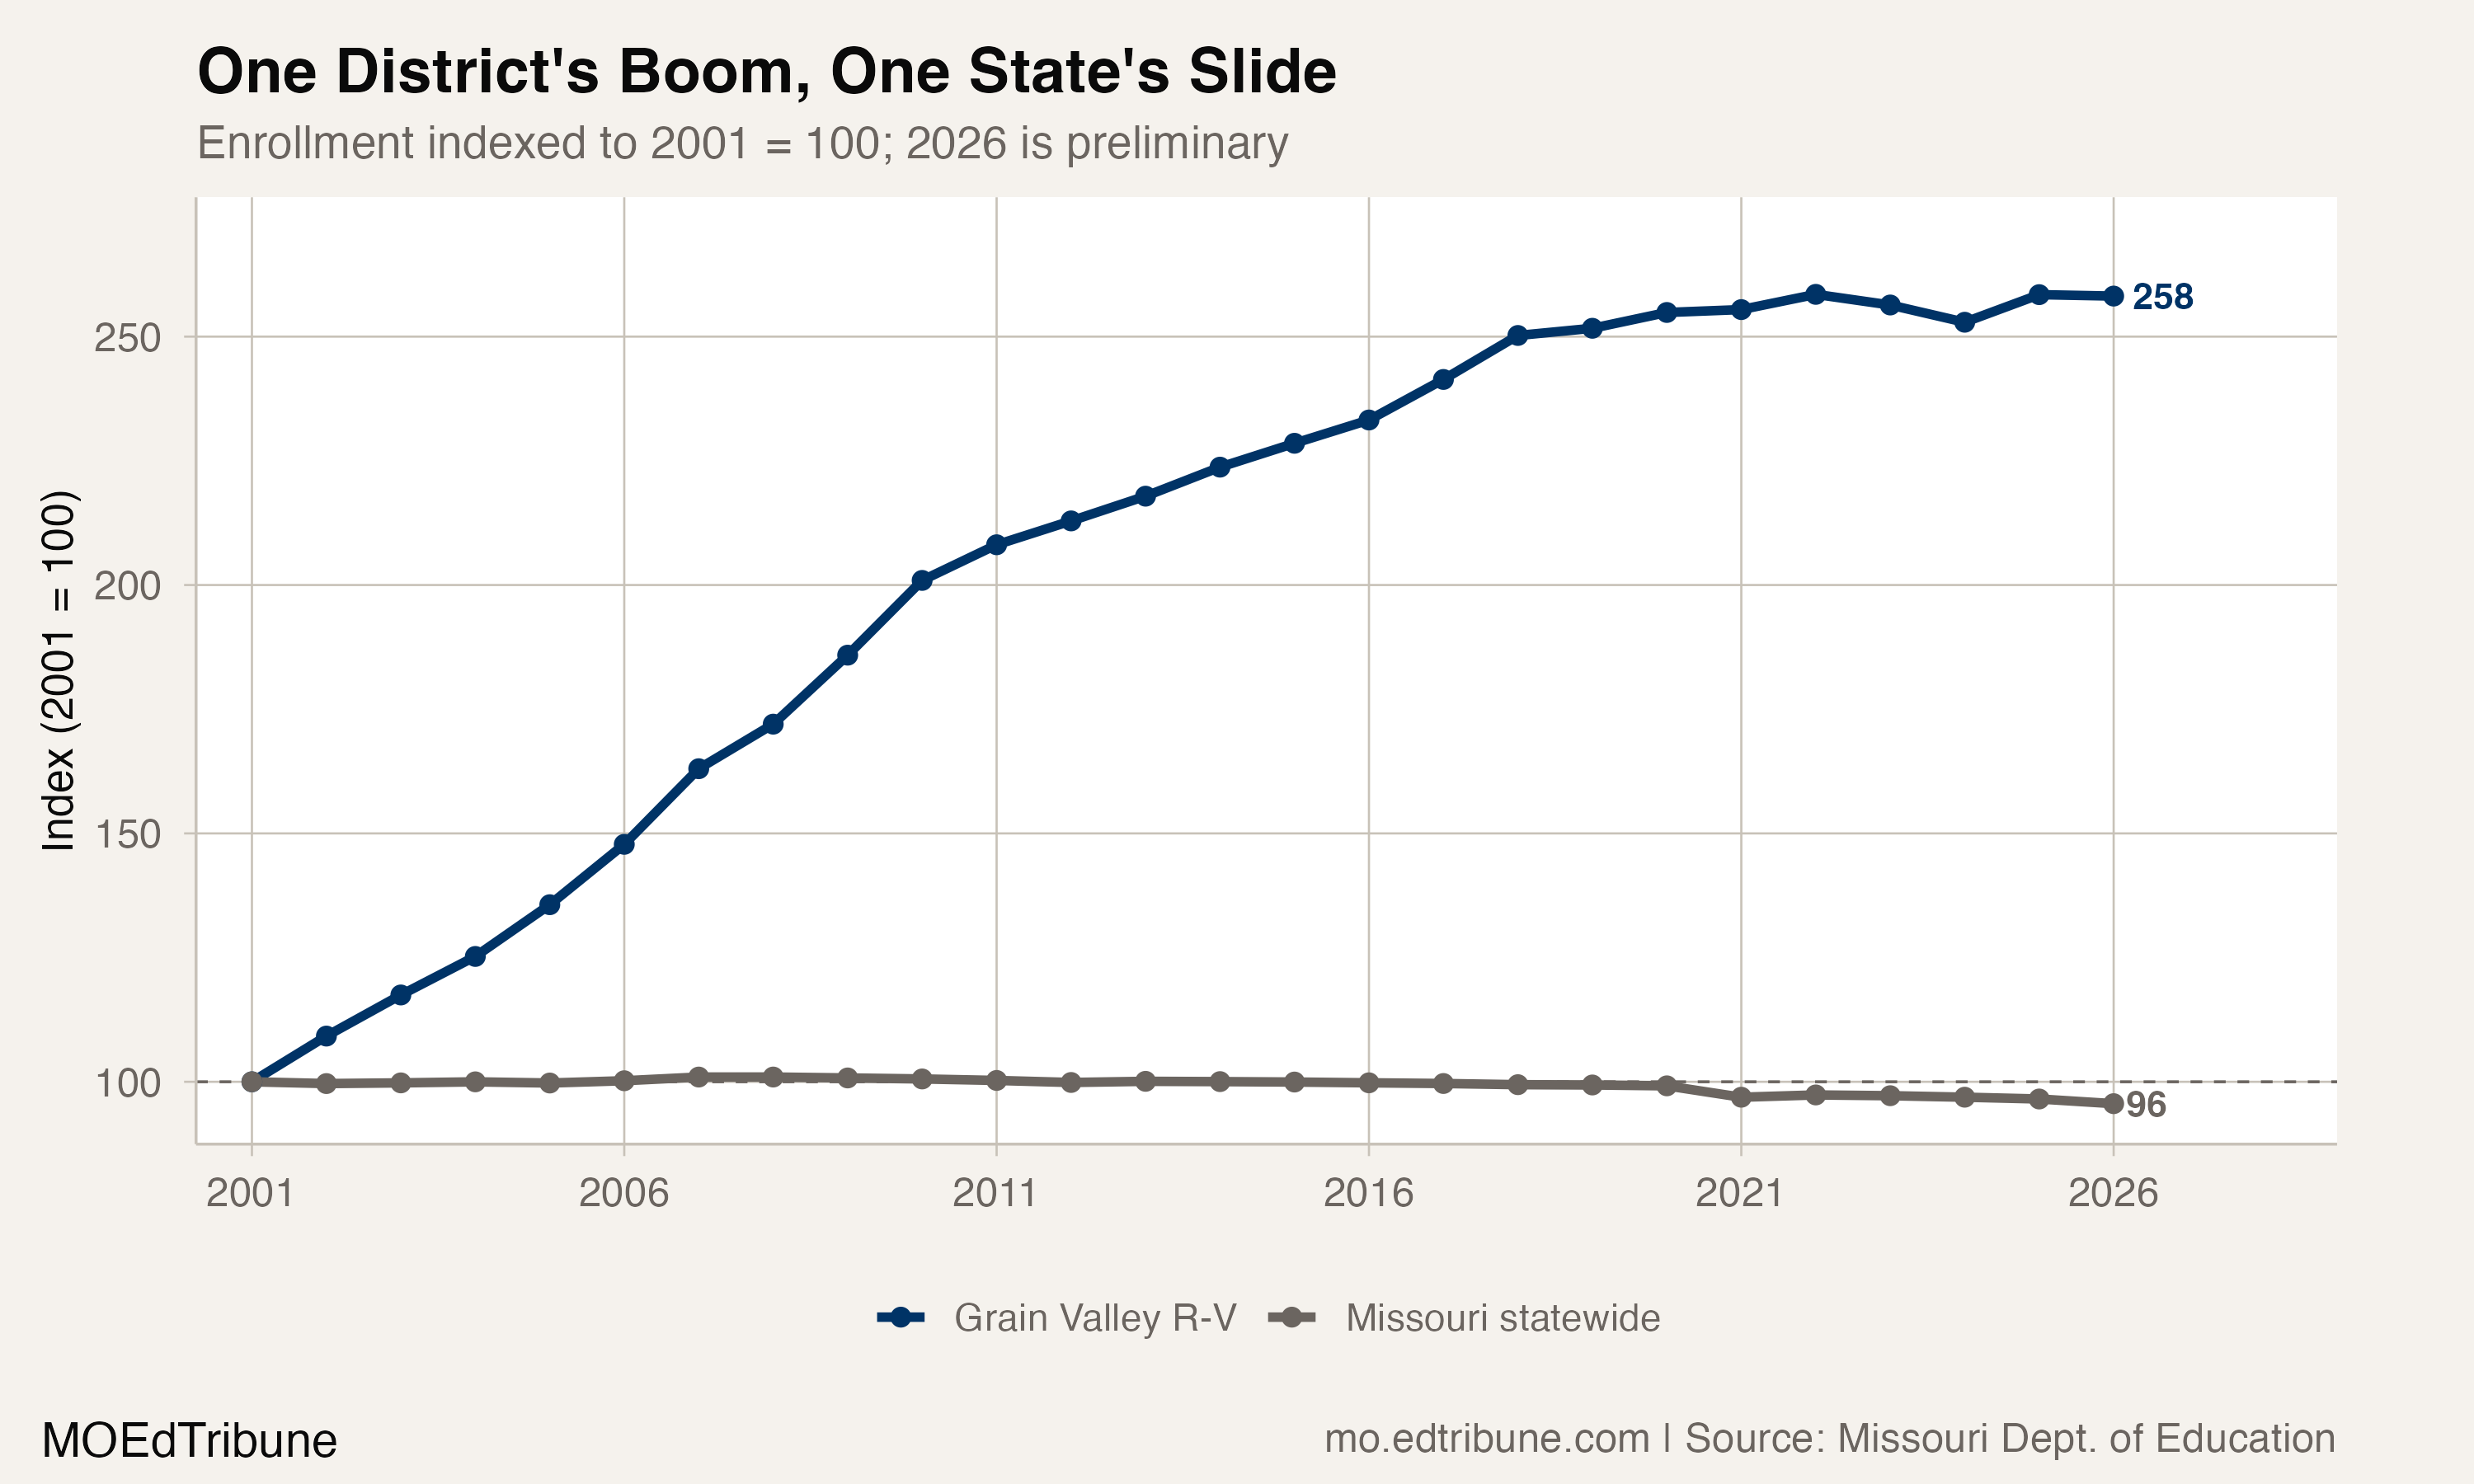
Indexed to 100 in 2001, Grain Valley stood at 258.2 in preliminary 2026. This is its own reported history, without a compatible statewide comparison.
Of the 510 native district records with complete positive totals across the observed 2001-2026 window, 197 were at their observed minimum in preliminary 2026, including ties. Grain Valley instead finished six students below its observed peak.
Capacity pressure can coexist with flat enrollment
KCUR’s historical April report says local voters approved a bond that included additions and renovations at Matthews and Sni-A-Bar Elementary Schools. The report attributed approaching capacity despite flat elementary enrollment to the district’s growing high-needs special education program. That is a reported facilities explanation, not a cause of the district’s total enrollment changes or a forecast of renewed growth.
Kindergarten offers one useful enrollment signal. Grain Valley kindergarten moved from 308 to 297 over the same period, a decline of 11, or 3.6%.
The result is a district near its observed peak but no longer posting uninterrupted gains. Grain Valley's 21-year streak remains exceptional. Its last published pattern is better described as a high plateau: two declines, one rebound and one small preliminary decline.
Published K12 totals exclude preschool. Comparisons use native district IDs and explicitly available positive totals from the DESE enrollment files; unknown records remain outside the comparison. Exact compatible statewide totals remain unavailable, and the observed window does not establish a first-ever peak or minimum.
Detailed code that reproduces the analysis and figures in this article is available exclusively to EdTribune subscribers.
Discussion
Sign in to join the discussion.
Loading comments...