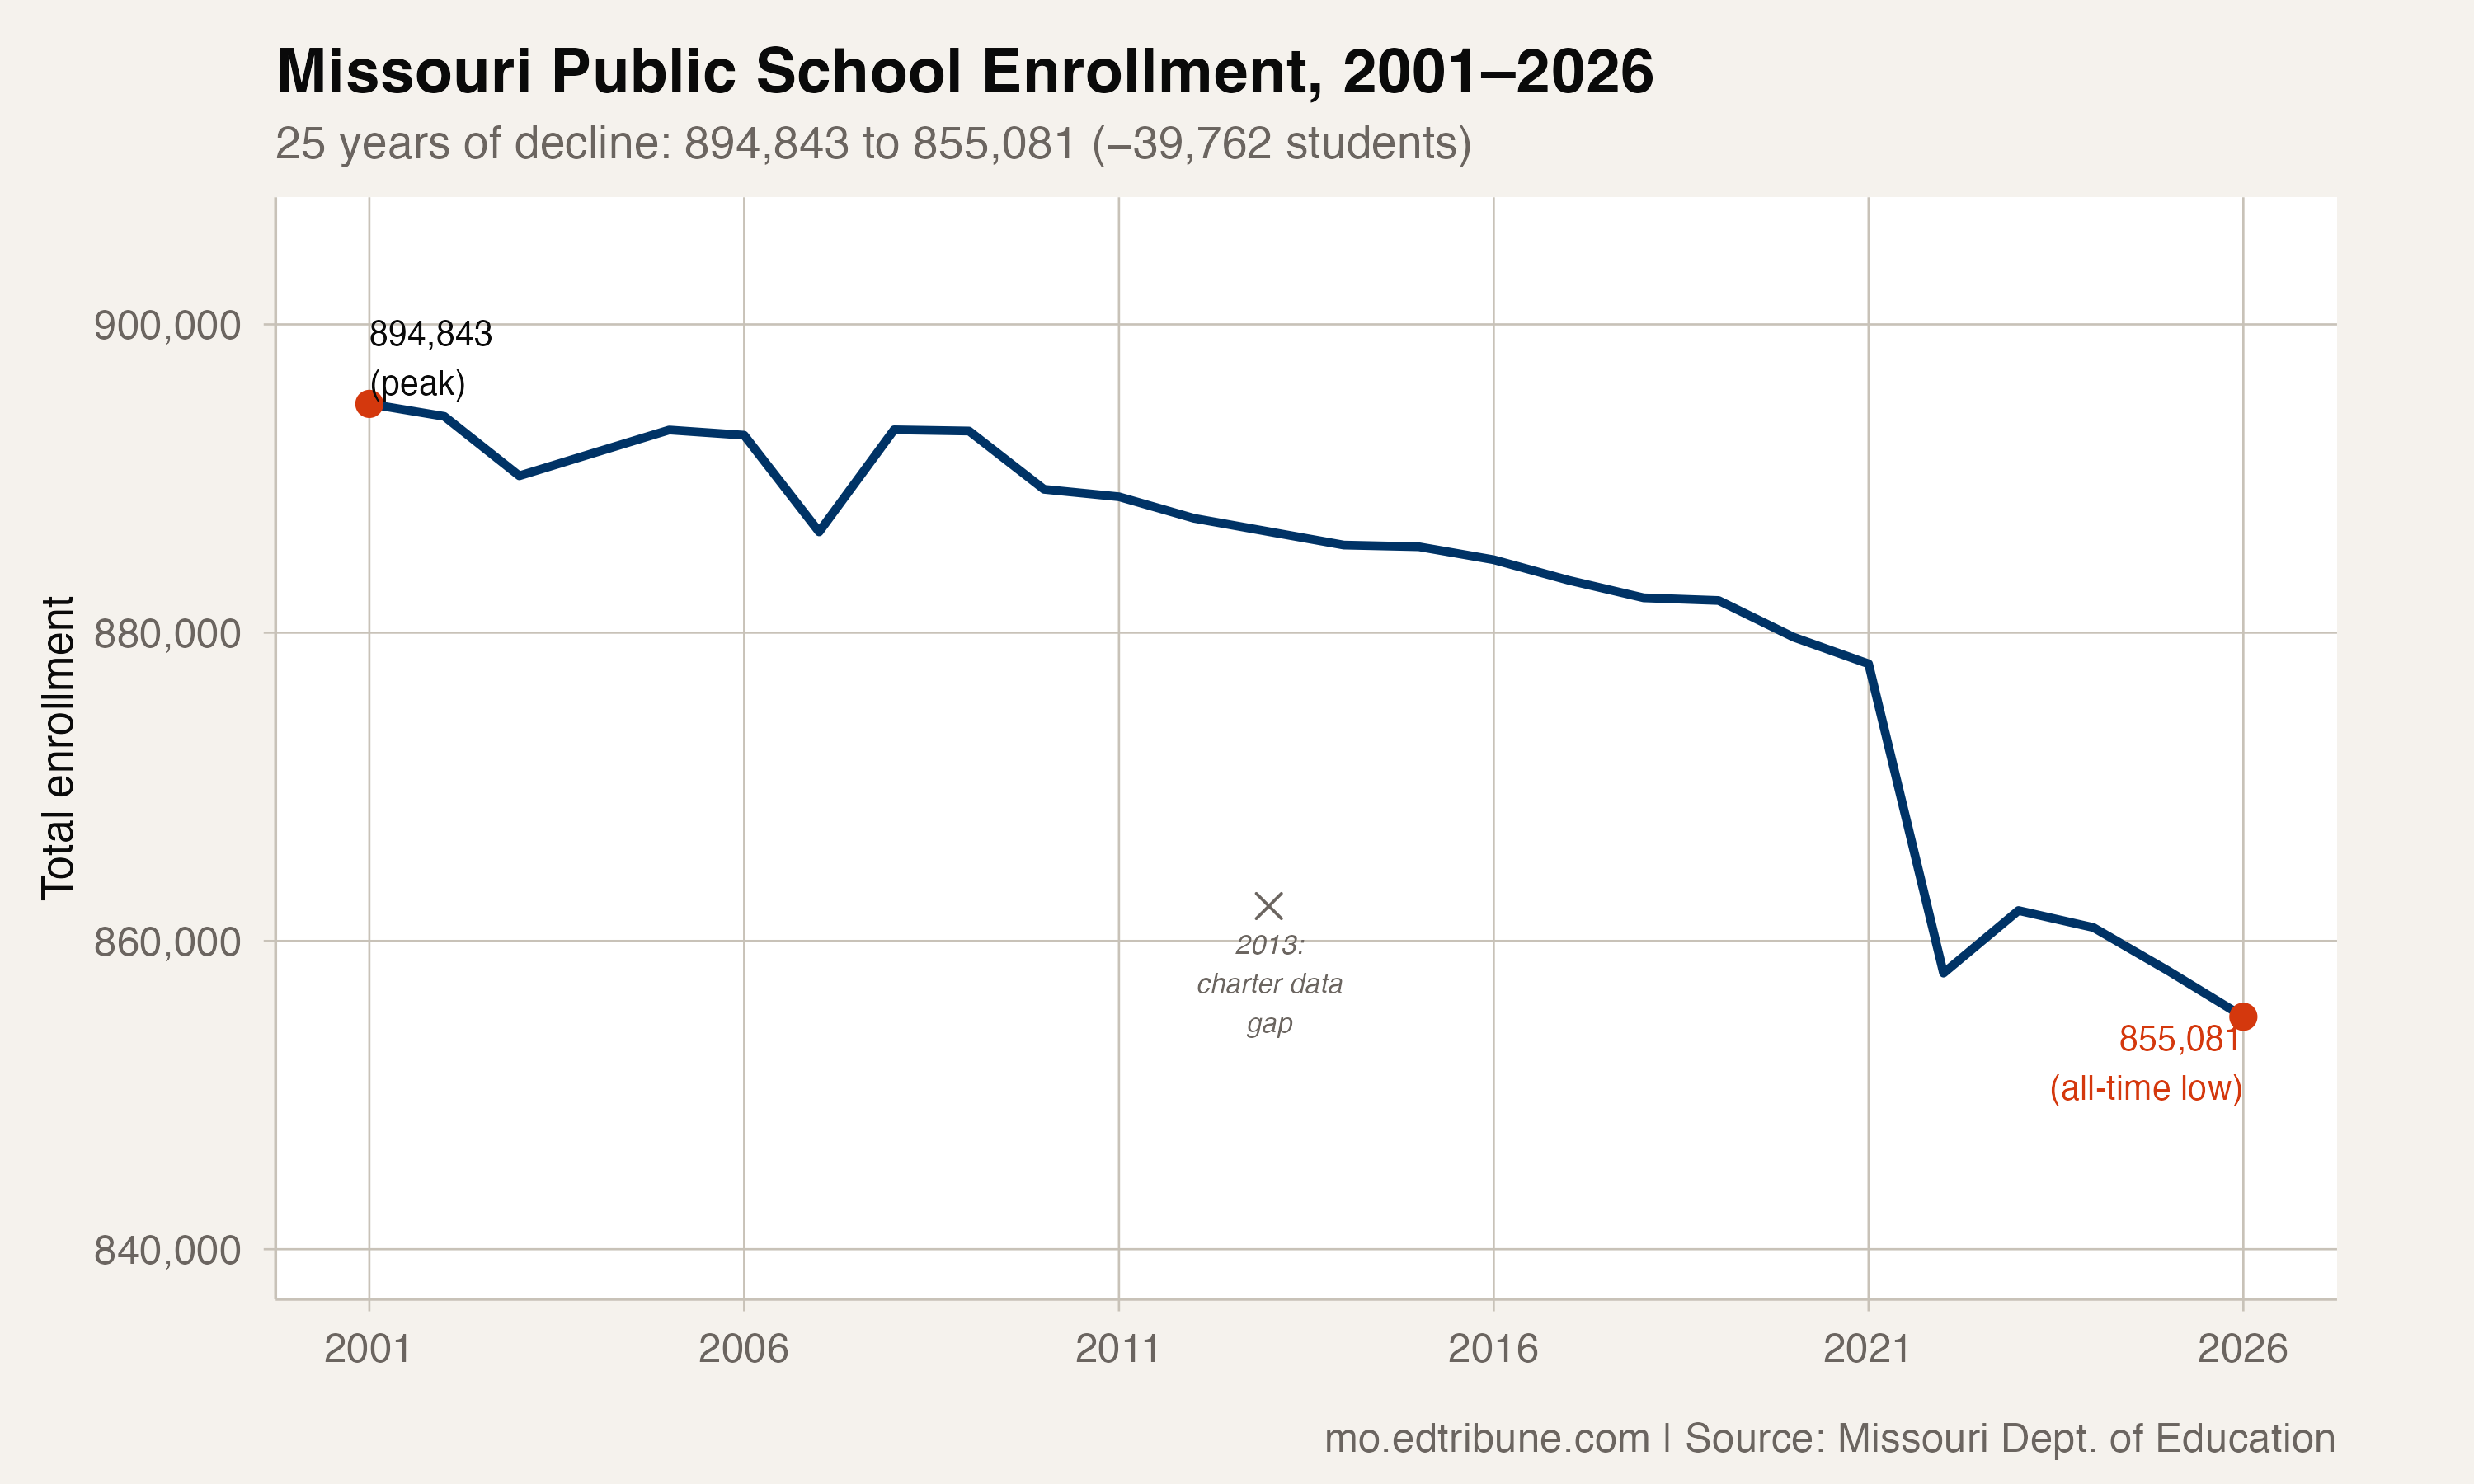
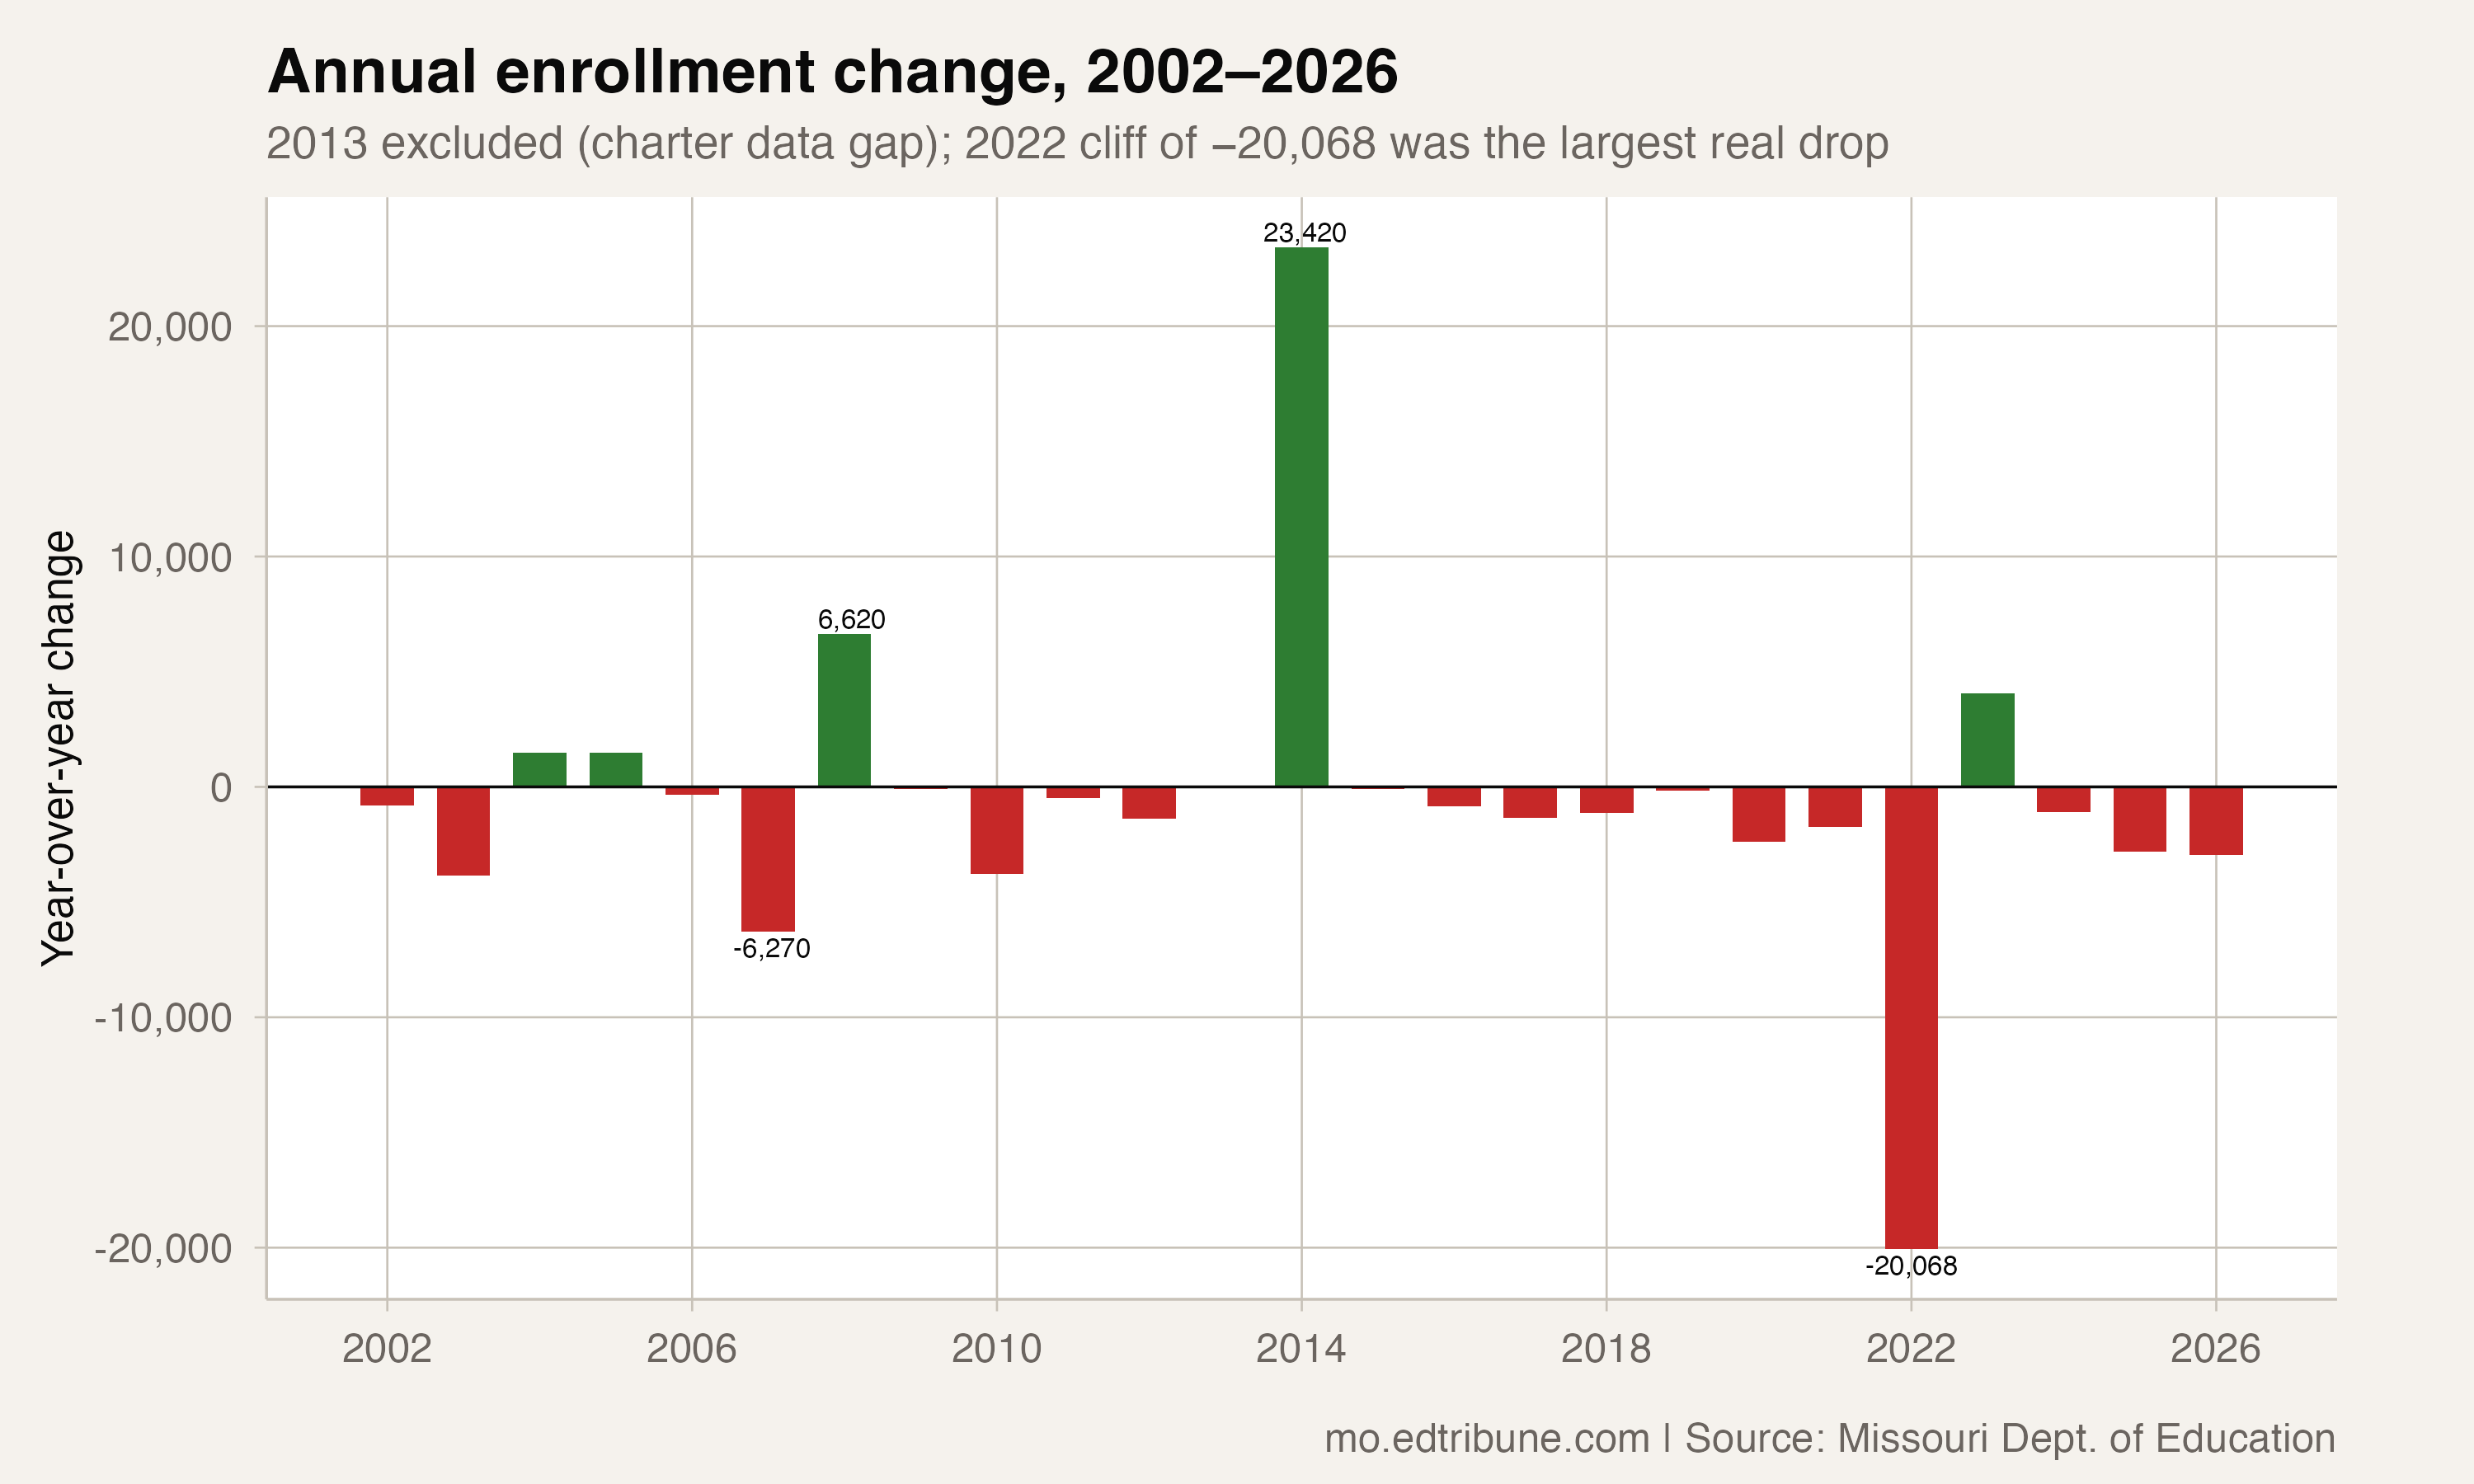
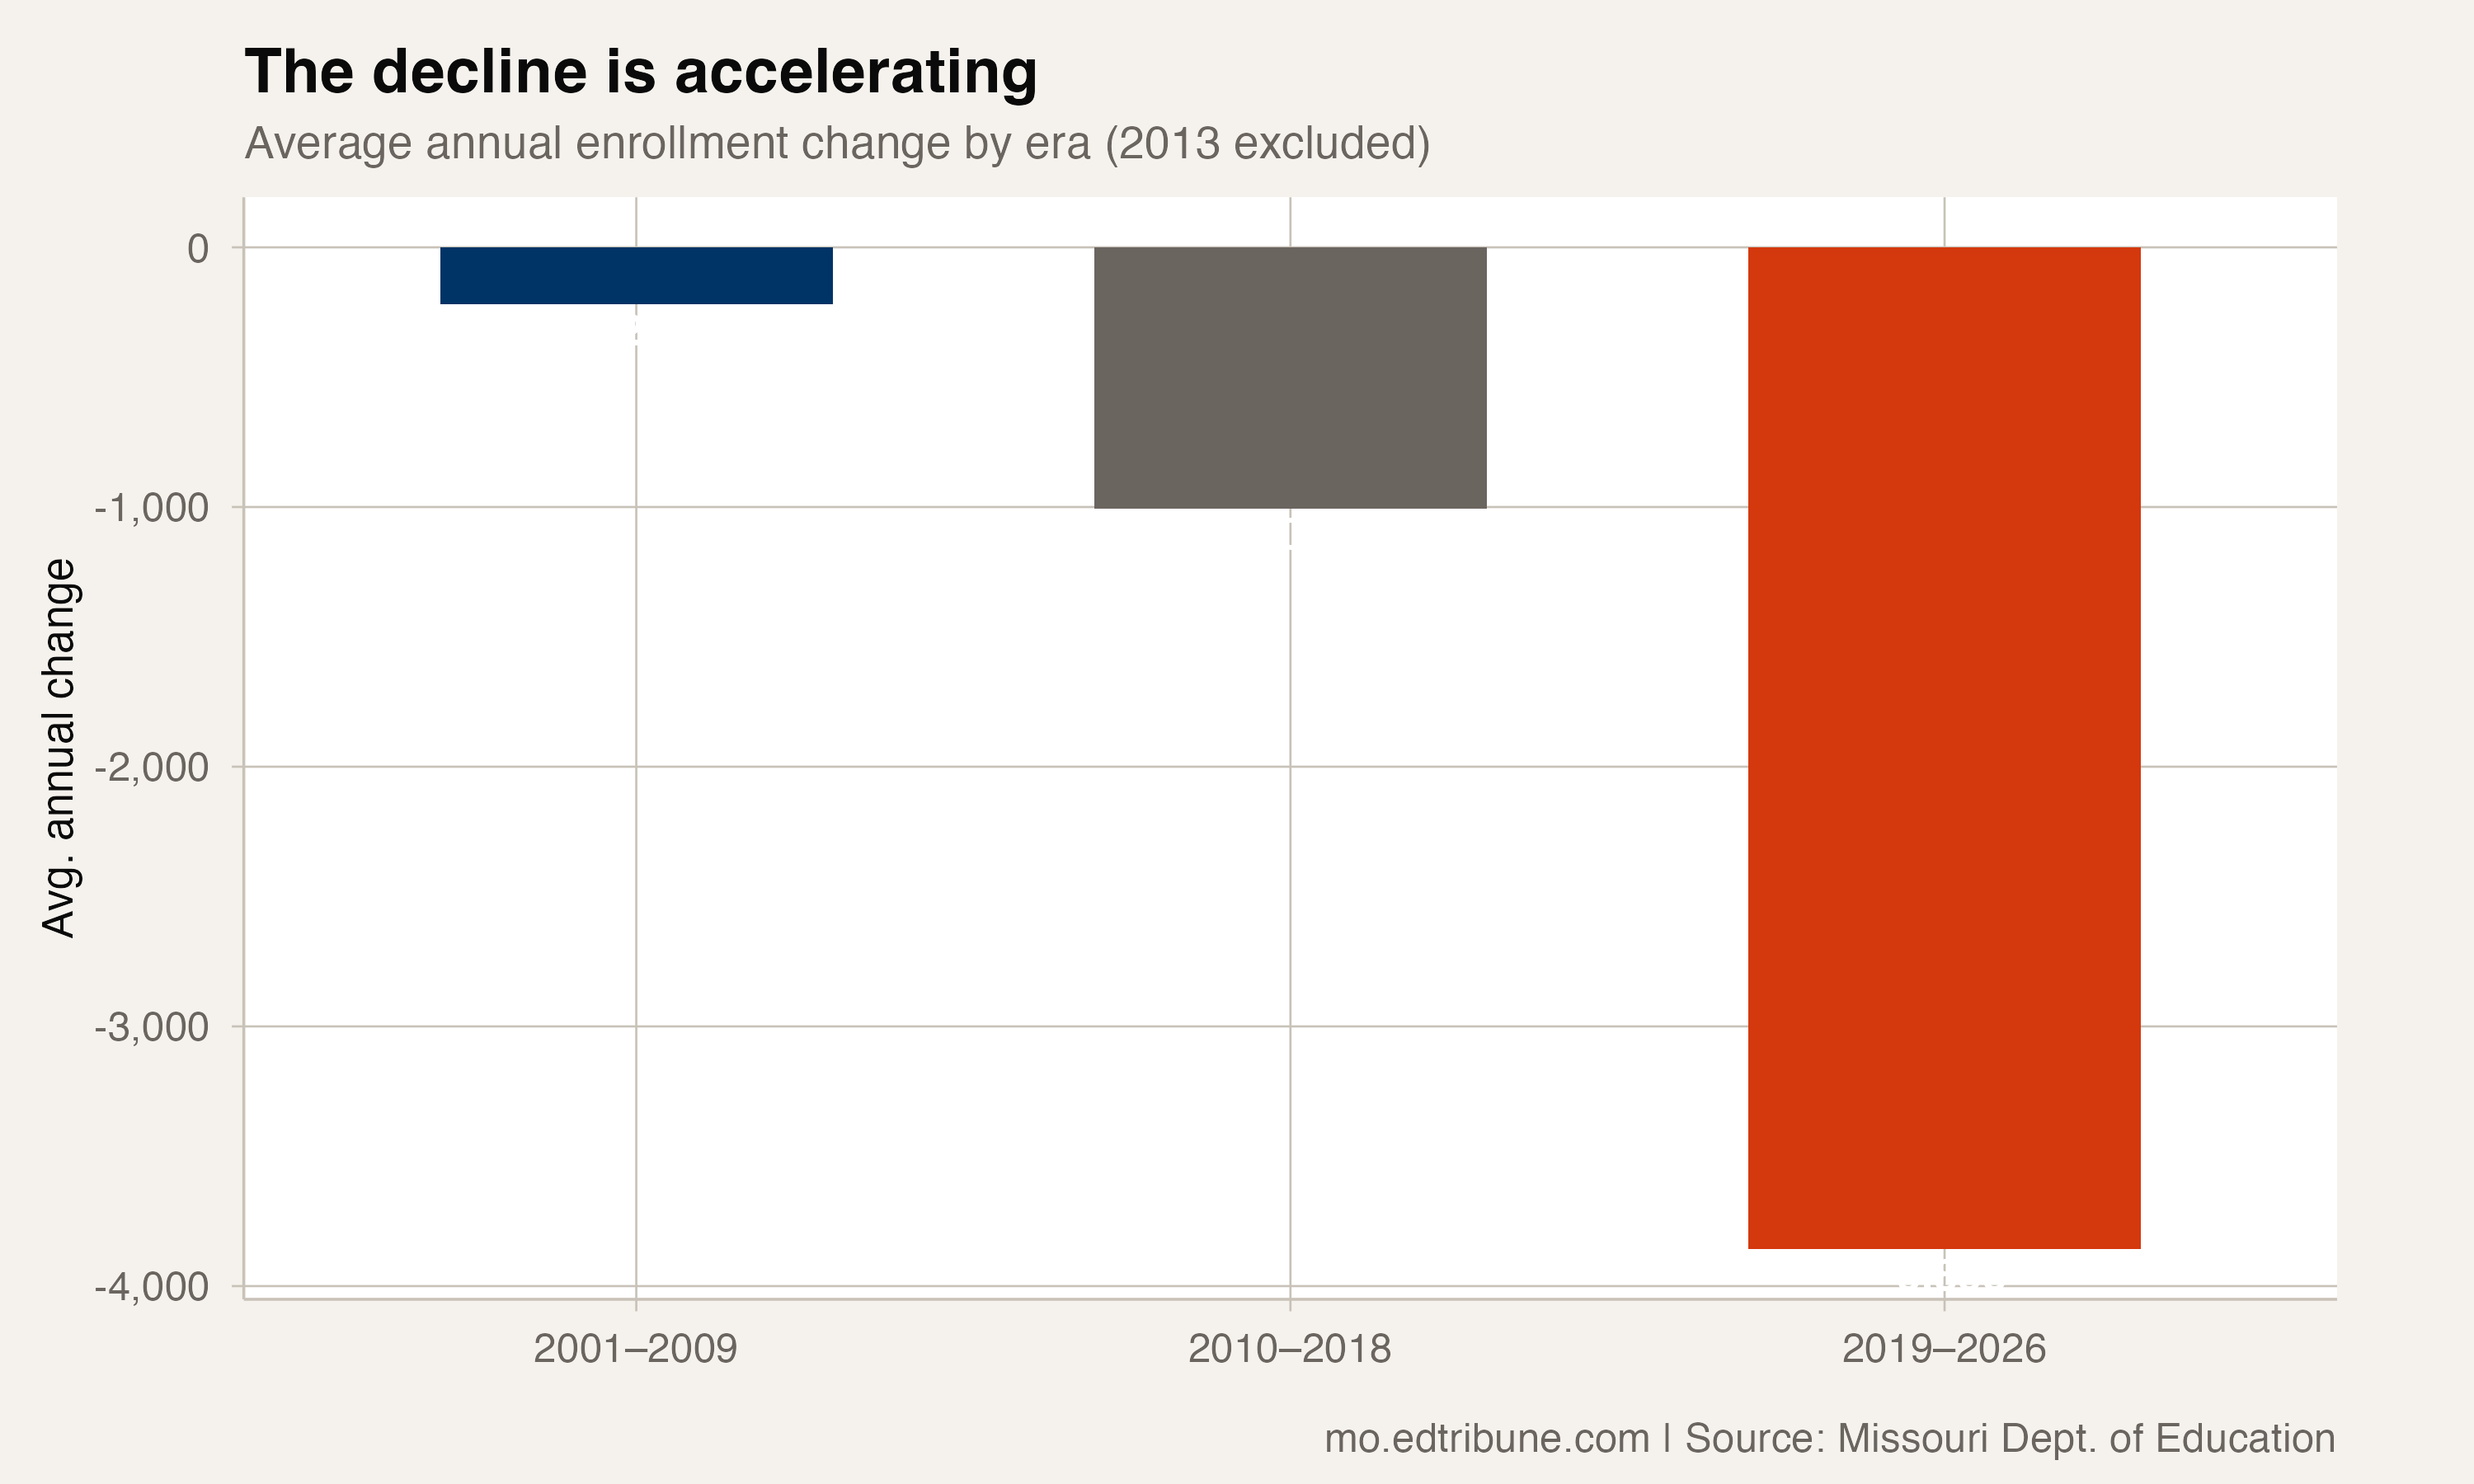
Correction (October 8, 2026): We have withdrawn this article’s claim that statewide enrollment reached a historical minimum. The district enrollment files contain unavailable counts, and summing the reported counts does not produce an exact statewide total. The earlier statewide totals, annual losses, era comparisons and “rest of the state” calculation are not supported on this consistent source basis. The district findings below have been independently recomputed; they describe reported district histories, not statewide enrollment.
Missouri’s reported district enrollment histories show substantial losses in some systems and growth in others. They cannot establish the exact statewide enrollment count or whether it reached a historical low.
This comparison uses published kindergarten-through-12th-grade totals, excluding preschool, from 2000-01 through 2025-26. Last school year’s 2025-26 counts are preliminary, and they are the most recent figures in these files. A district must have a reported count in every year to enter the fixed-window extrema comparison below. Districts without that complete history, including charters without earlier observations, do not enter that comparison.
Two city districts’ losses
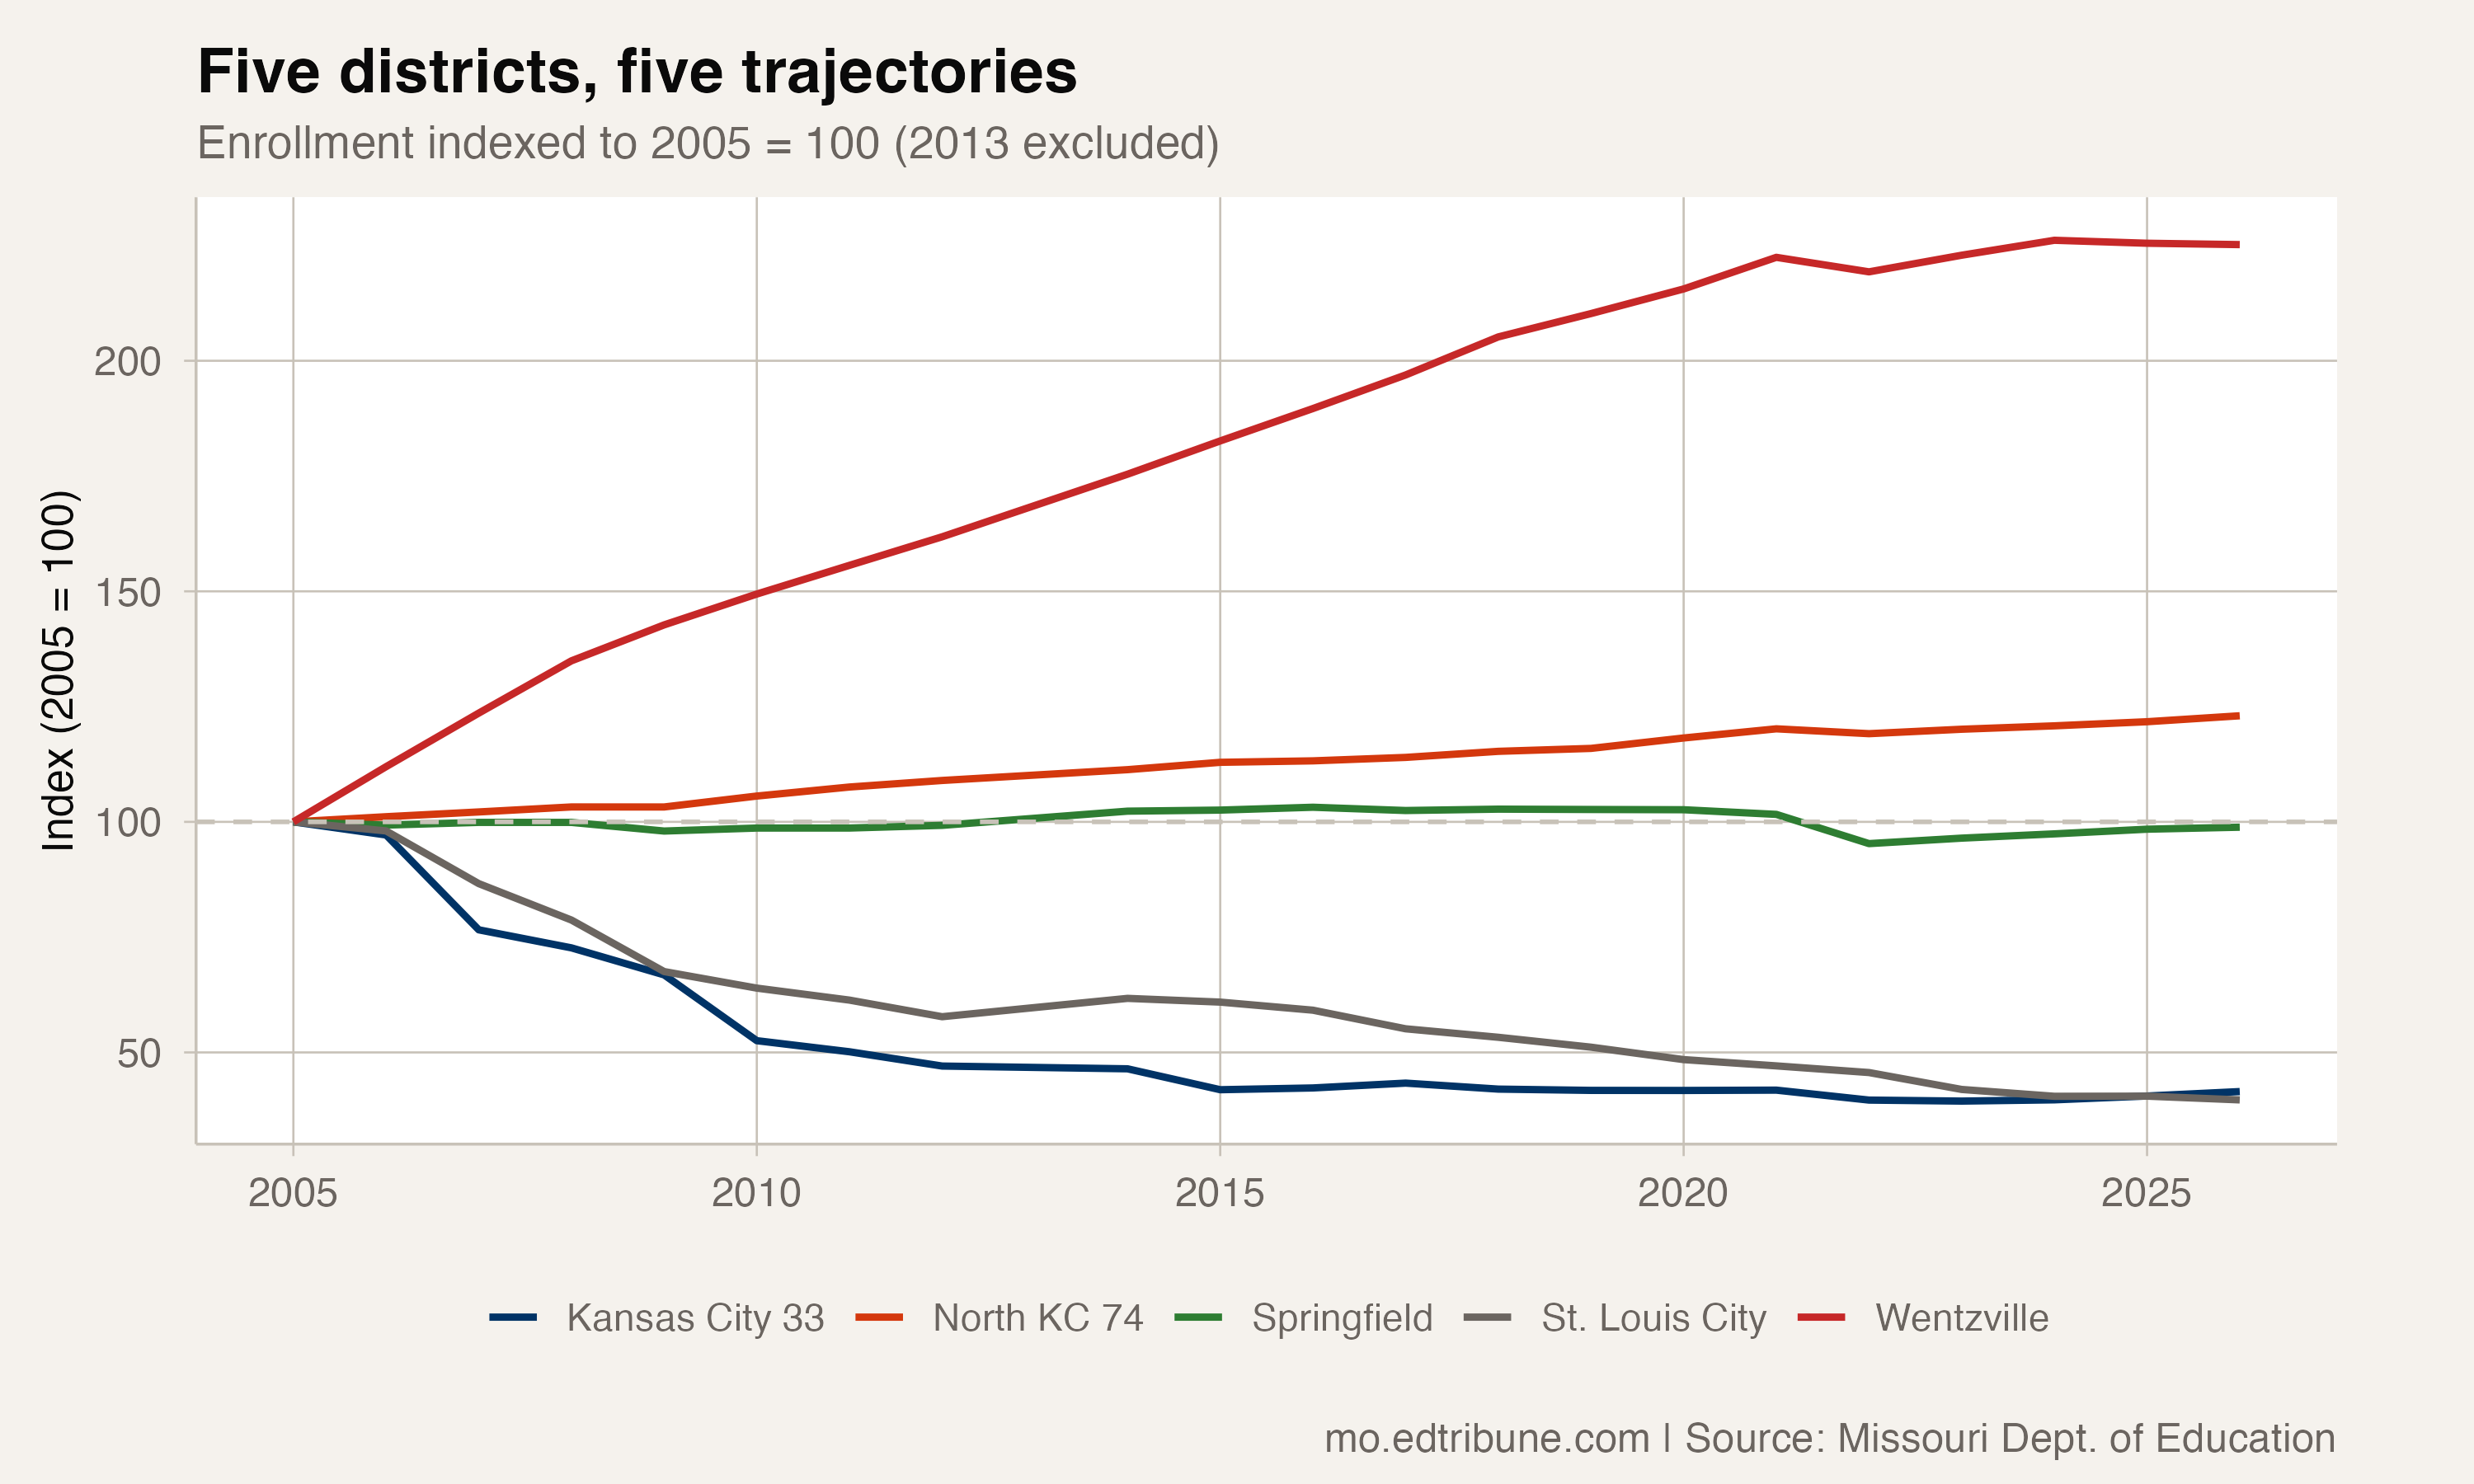
St. Louis City↗ET reported 41,988 students in 2000-01 and 15,558 in preliminary 2025-26: a loss of 26,430, or 62.9%. Kansas City Public Schools↗ET went from 31,026 to 13,957, a 55.0% decline. Together, those two districts lost 43,499 students between the endpoints.
That combined loss can be measured directly. It cannot tell us whether enrollment elsewhere offset it, because an exact compatible statewide total is unavailable. Unavailable district counts are not zero students.
Normandy Schools Collaborative↗ET declined 57.4% over the same window. Riverview Gardens↗ET declined 34.6%, and Ferguson-Florissant↗ET declined 27.8%.
Growth and decline in the named comparison
Wentzville↗ET grew from 6,003 students to 17,375, a 189% increase. Its complete annual history starts with 19 consecutive transitions without a decline before a loss in 2020-21. That is a sequence of changes between annual observations, not a count of all-time growth years.
North Kansas City Schools↗ET had a maximum of 20,915 students within this observed window and reported 20,754 in preliminary 2025-26. Grain Valley↗ET grew from 1,728 to 4,461 and began the window with 21 consecutive transitions without a decline.
The named comparison also includes Parkway↗ET, down 19.7%; Hazelwood↗ET, down 17.0%; Rockwood↗ET, down 13.7%; and Francis Howell↗ET, down 13.3%. Each percentage compares its own two published endpoints.
Reported pandemic-year comparisons
For 2020-21, 557 districts had reported counts in both that year and the preceding year. Of those matched districts, 398 declined. This counts districts with comparable observations; it does not estimate a statewide student loss.
Springfield↗ET lost 1,539 students in that annual comparison. Its preliminary 2025-26 enrollment was 23,512, the largest reported district count in that year, and 3.8% below its own 2000-01 count.
Observed extrema in a complete district window
There were 510 districts with all 26 annual counts from 2000-01 through preliminary 2025-26. Within that fixed comparison, 197 districts ended at their observed minimum and 12 at their observed maximum. Ties count in both tests. These are minima and maxima within the stated observation window; they do not establish all-time records or a statewide enrollment minimum.
The Missouri Department of Elementary and Secondary Education’s enrollment files supply the published district totals. Missing totals remain unavailable; other statewide publications are not spliced into this district series.
Detailed code that reproduces the analysis and figures in this article is available exclusively to EdTribune subscribers.
Discussion
Sign in to join the discussion.
Loading comments...