Correction (October 8, 2026): The supported district enrollment histories below have been reverified on authenticated state files. We have withdrawn exact statewide totals and statewide shares because no compatible exact statewide total is available in these files. English learner counts and shares have been independently reconciled to the state’s authenticated demographic file and restored. The Collier quotation now uses an exact sentence from the cited report rather than the previously stitched wording. Extrema refer only to the stated observation window, and the counts do not establish why enrollment changed.
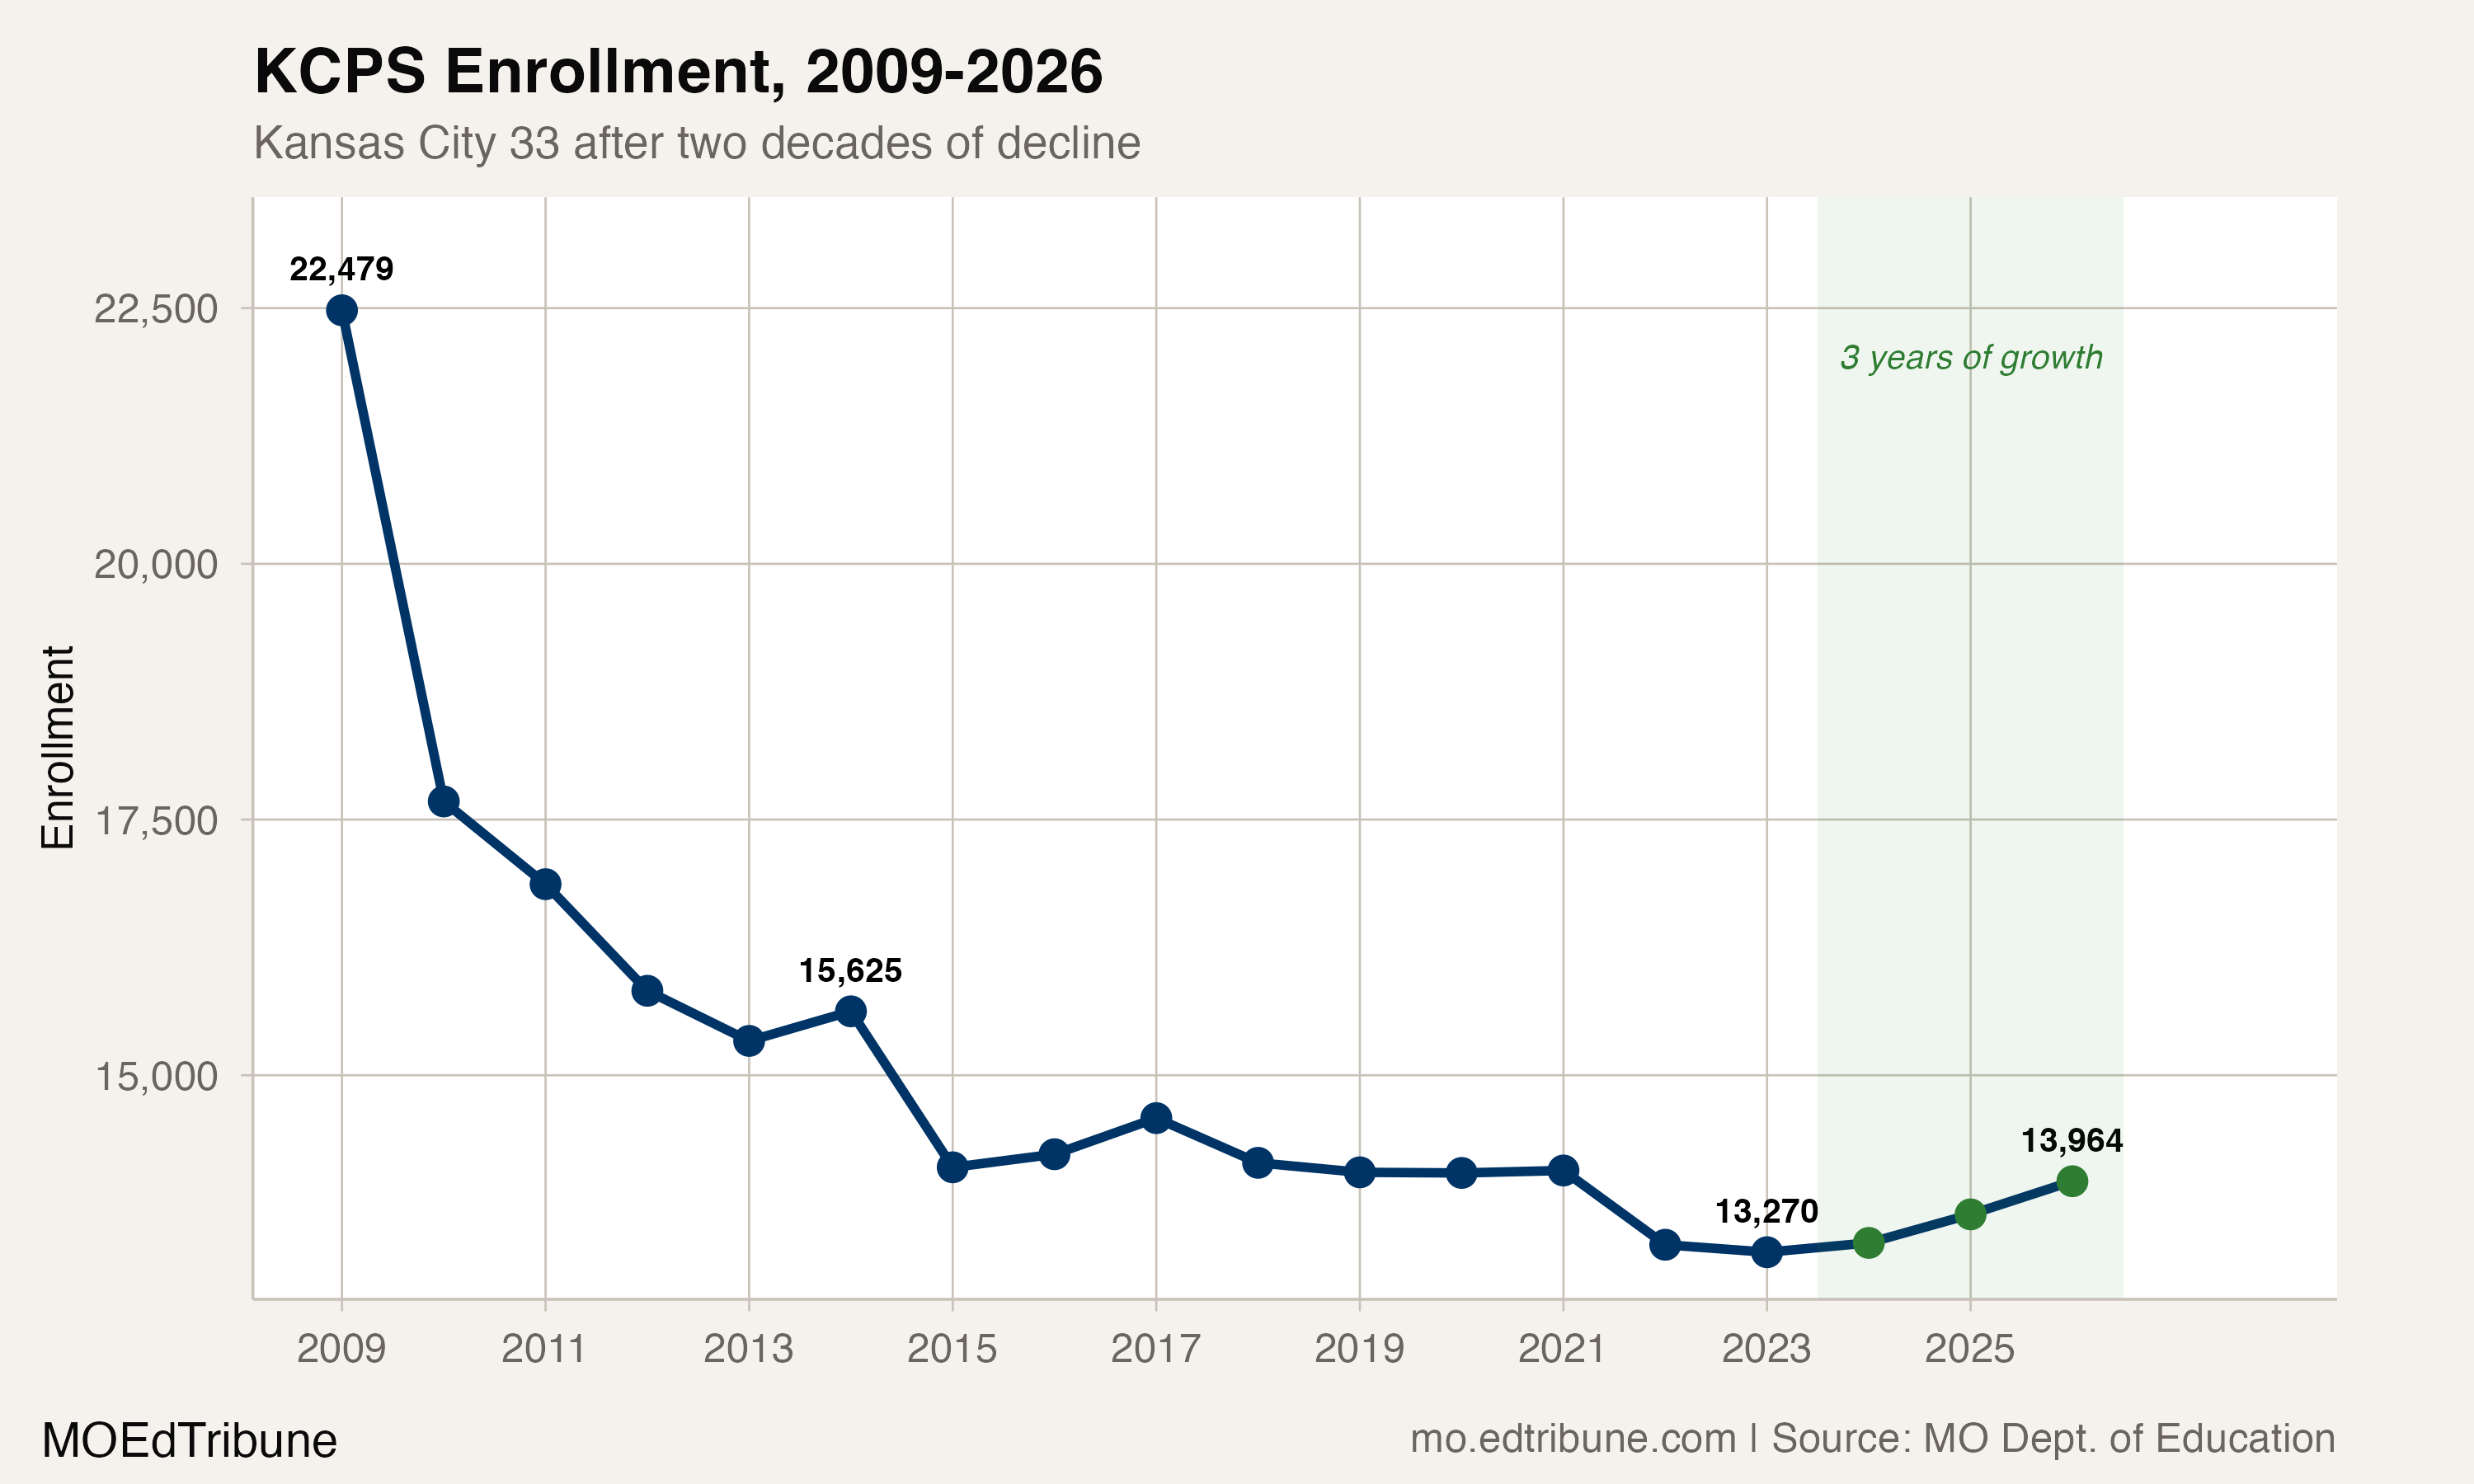
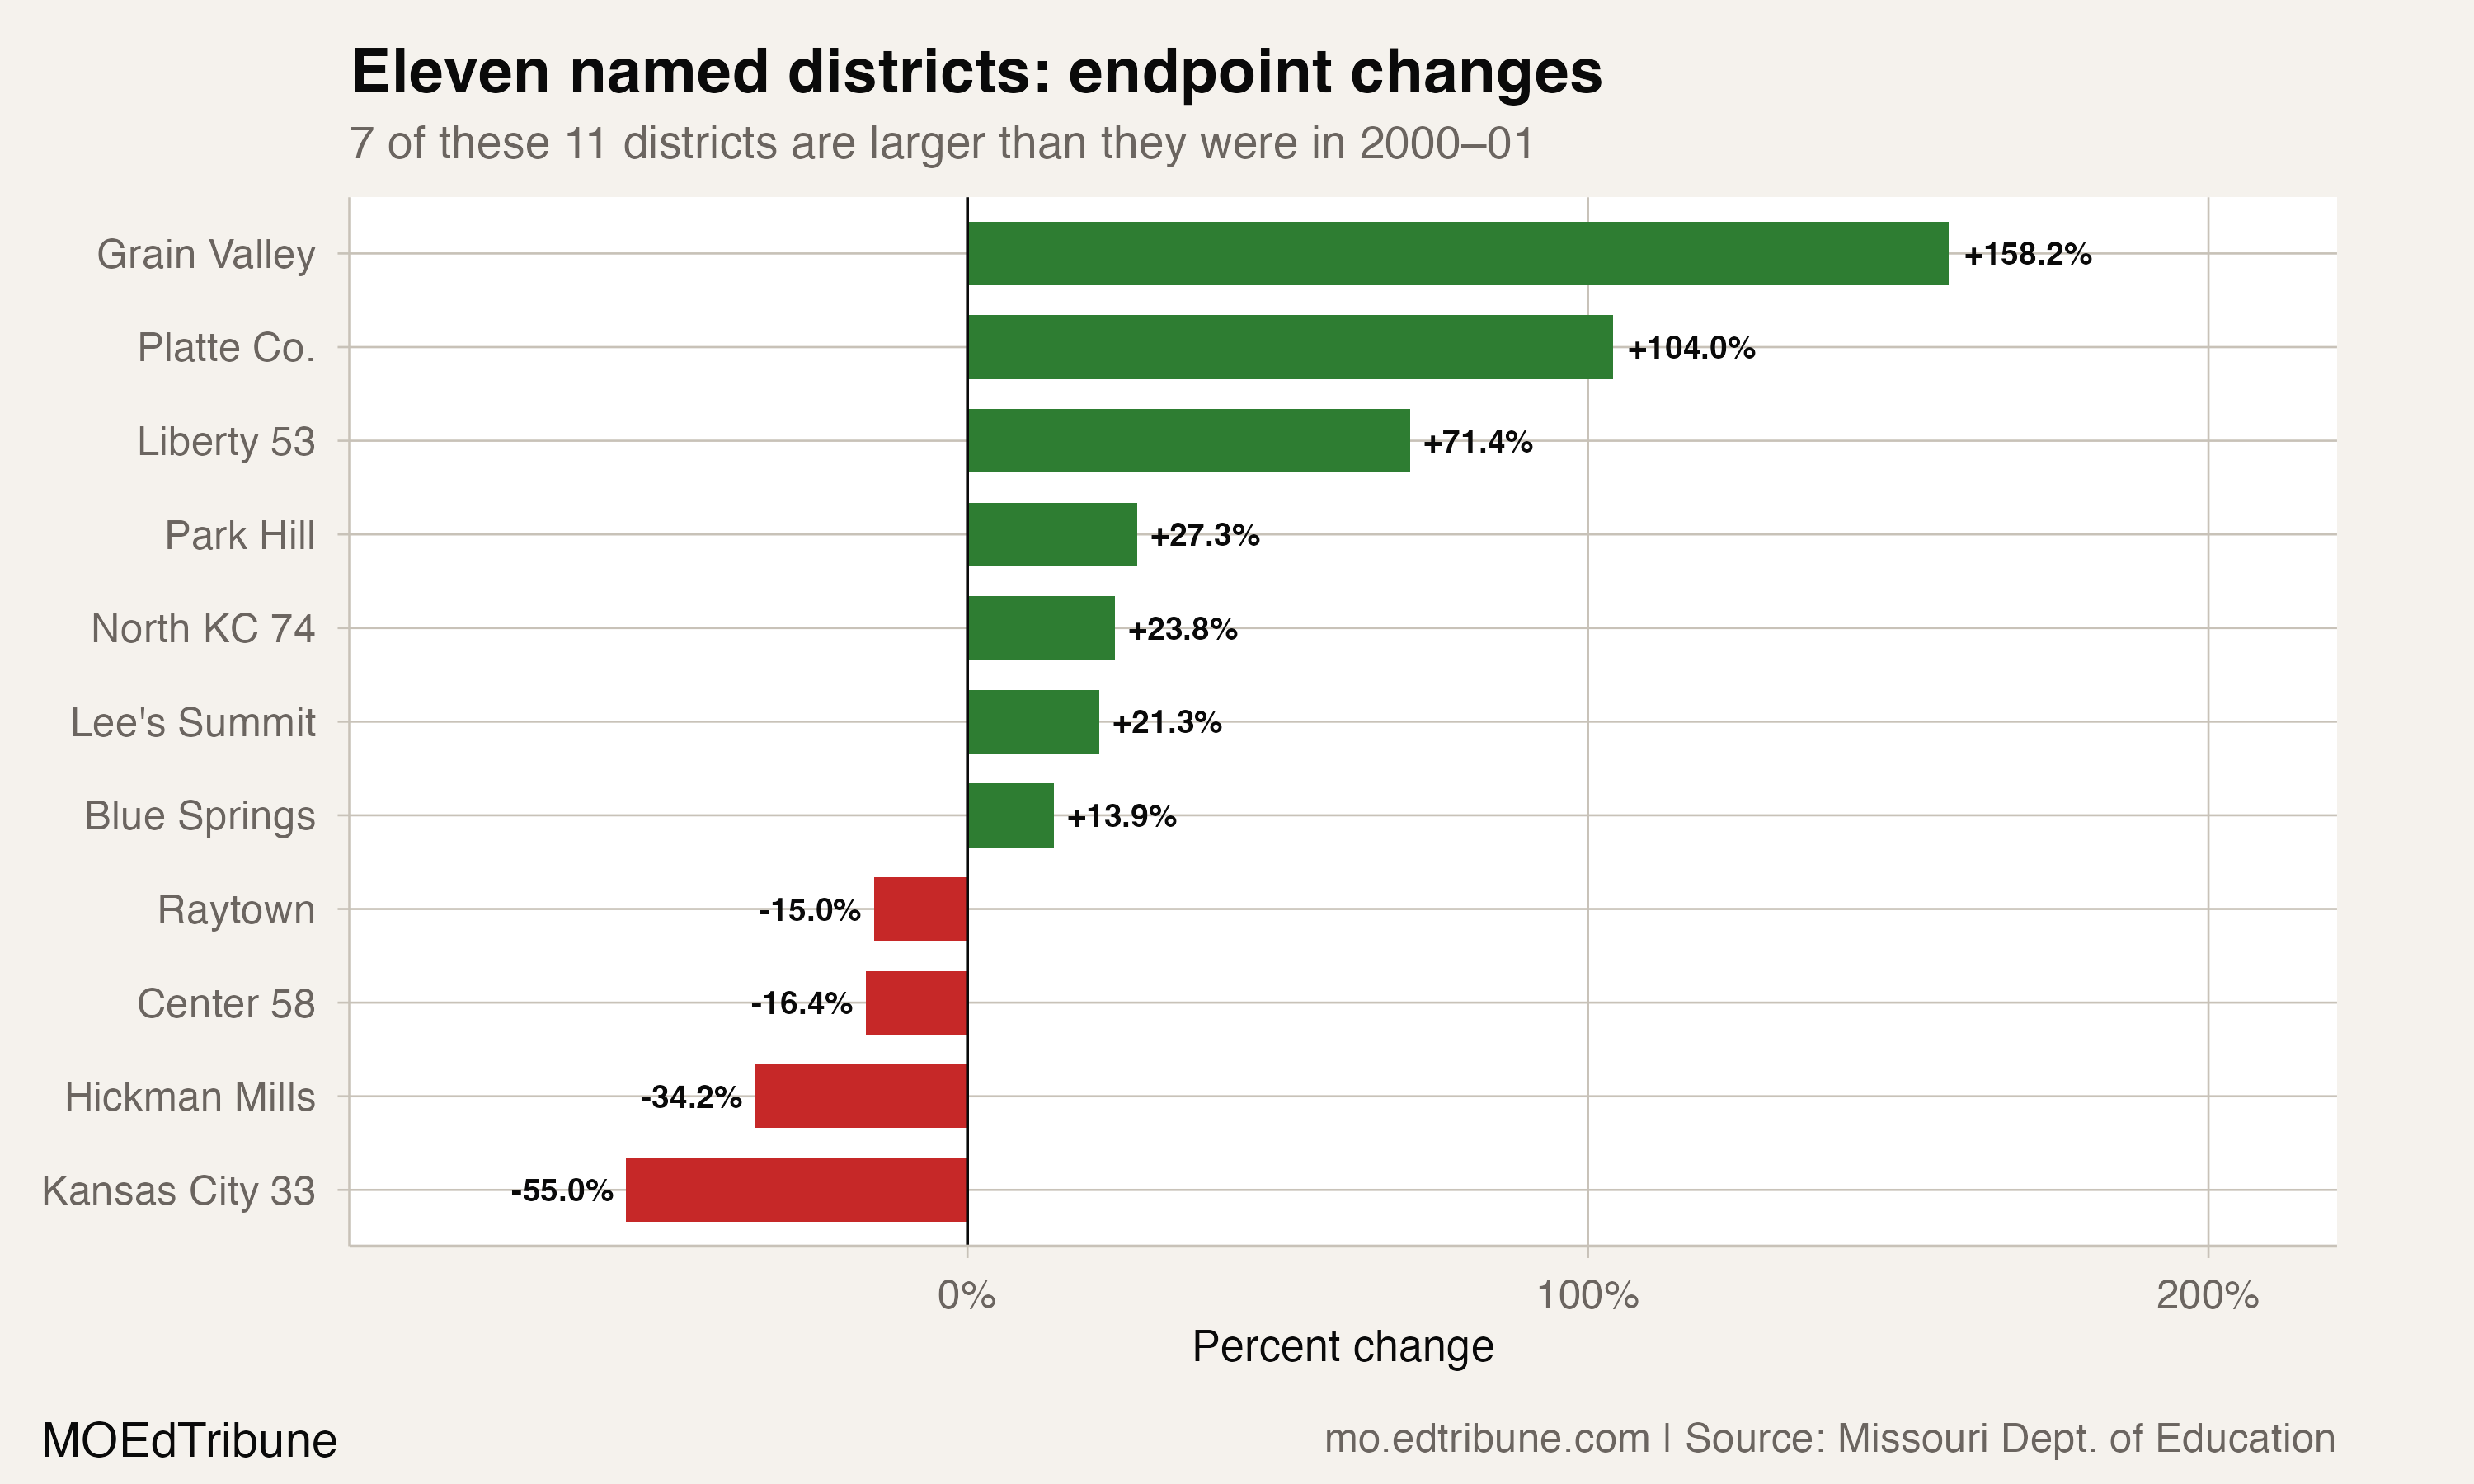
Kansas City Public Schools↗ET reported 31,026 students in 2000-01 and 13,957 in preliminary 2025-26, last school year and the most recent year in these files. The decline between those endpoints was 17,069 students, or 55.0%.
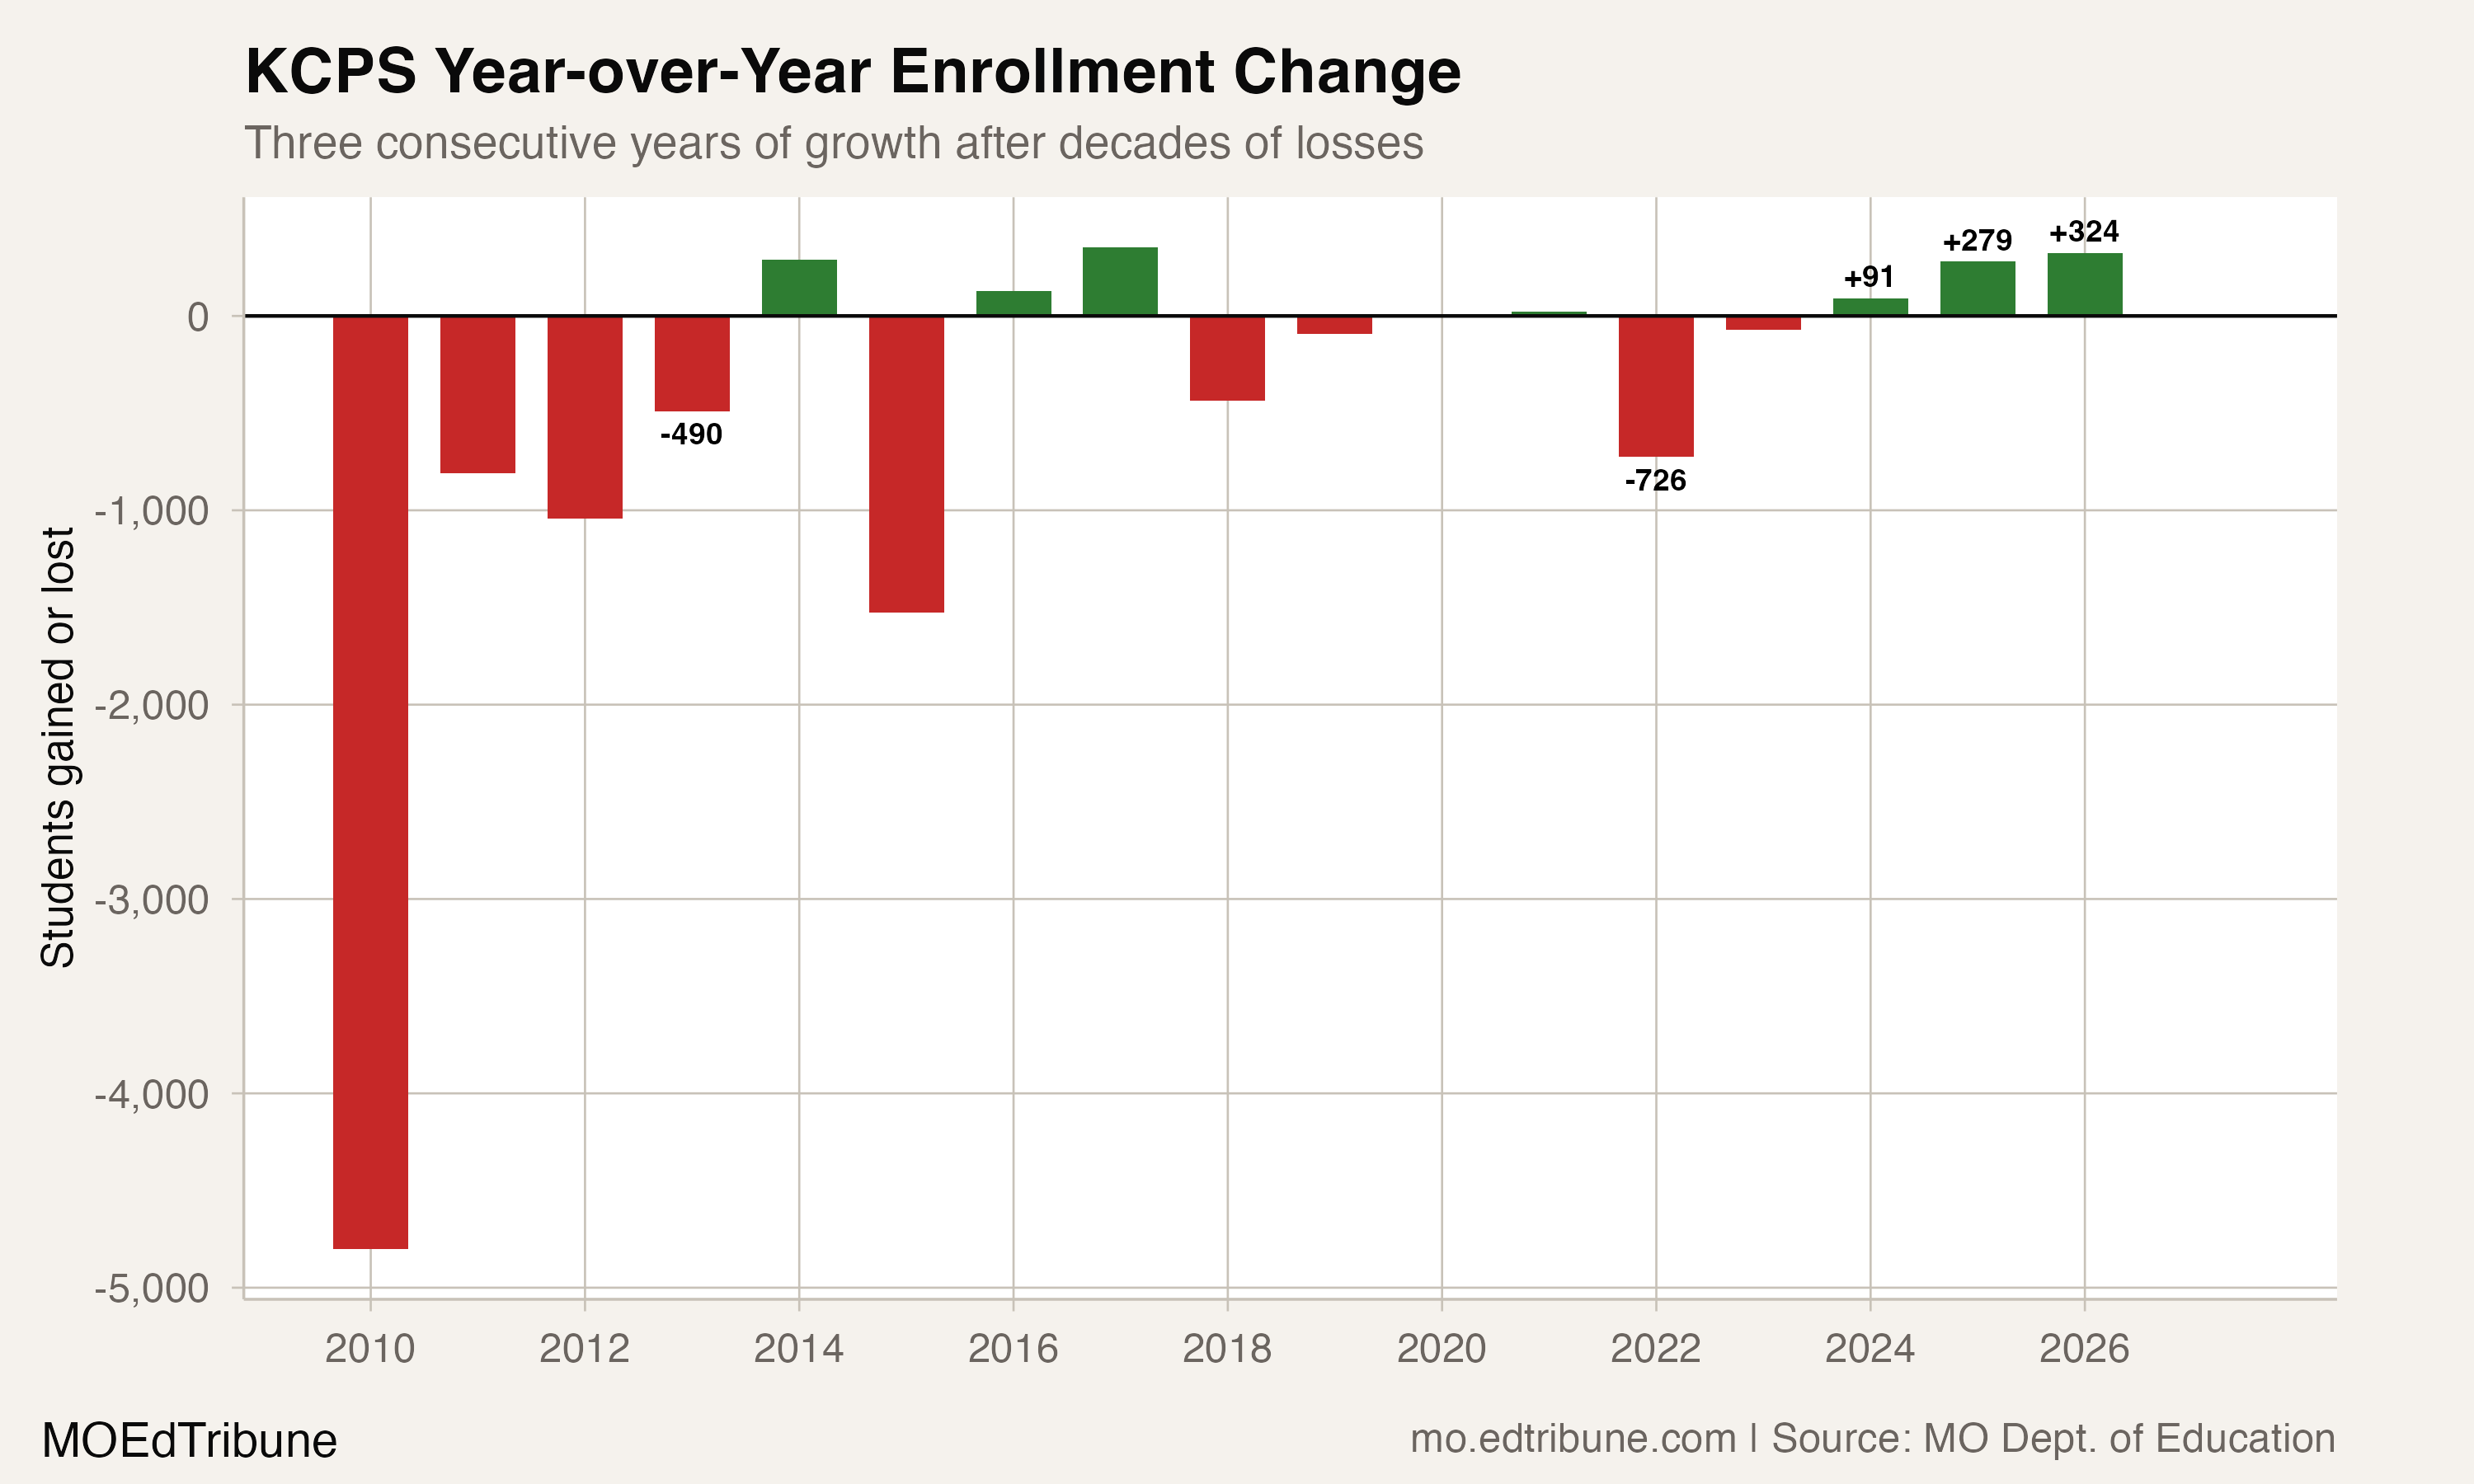
The district’s lowest observed count in that window came in 2021-22, at 13,270. It then gained students in three consecutive annual comparisons: 91 in 2022-23, 279 in 2023-24 and 324 in 2024-25. The preliminary 2025-26 count was seven students below the preceding year. That last change was small, but it ended the run of annual gains.
Every named district comparison uses published kindergarten-through-12th-grade enrollment totals, excluding preschool, throughout 2000-01 through preliminary 2025-26. The district histories are complete in that window. They are administrative district counts, not a fixed-boundary history of every child living in Kansas City.
A substantial decline, and a changing roster
Between 2000-01 and 2007-08, Kansas City’s published count fell by an average of 1,221 students per year. Its steepest annual decline within this window came in 2008-09: a loss of 4,802, from 22,479 to 17,677. The number of distinct school records with a published K12 total fell from 64 to 59. Those are reported school identifiers, not an independent inventory of physical buildings or closures.
The school records also reveal a comparability issue. Five school names present under Kansas City in 2007-08 appear as new names under Independence↗ET in 2008-09, including Van Horn High and Clifford H. Nowlin Middle. The Independence district’s count rose from 10,707 to 13,128, an increase of 2,421.
That name match documents a change in the reported rosters. It does not measure how much of either district’s annual change came from a legal boundary transfer, births, migration or students choosing another school. The files alone do not assign those contributions.
From 2008-09 through Kansas City’s observed low in 2021-22, its average annual decline was 339 students. The two periods describe different arithmetic rates of loss; they do not identify a mechanism.
How unusual was the run of gains?
Kansas City was one of 42 districts that gained students in each of 2022-23, 2023-24 and 2024-25, among 555 districts with all three consecutive annual comparisons available. This comparison excludes incomplete histories rather than treating missing counts as zero.
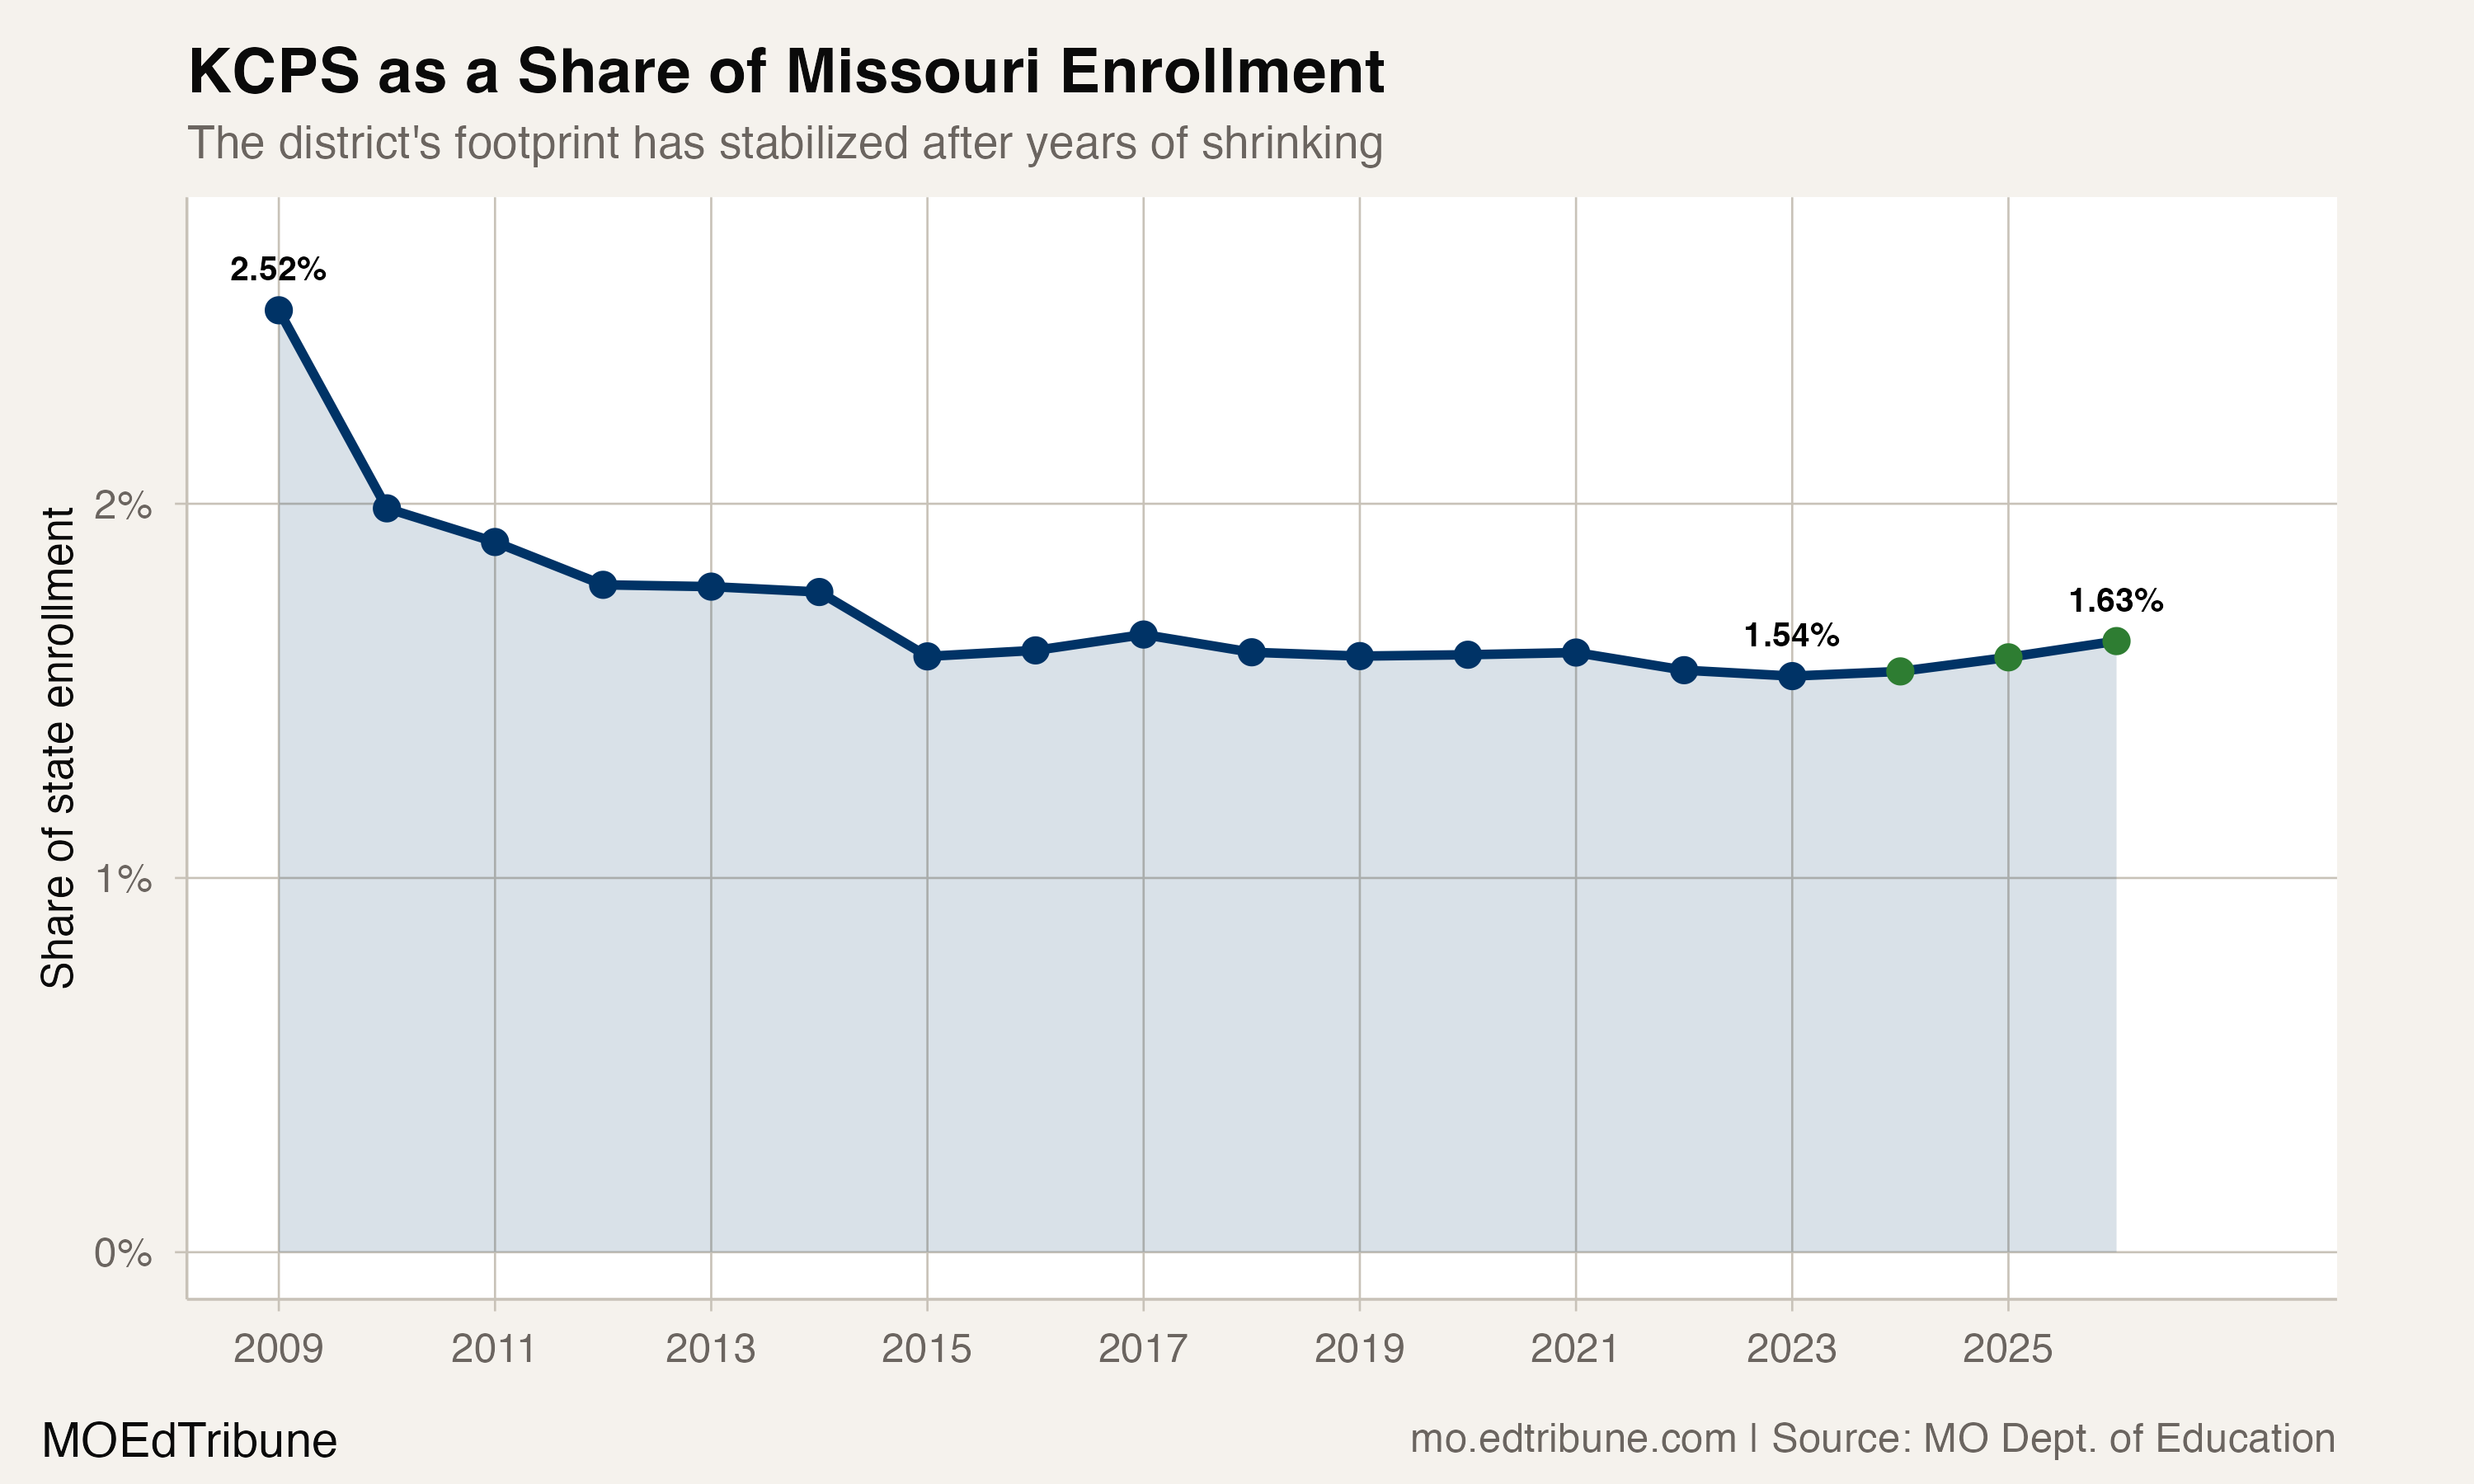
Of those 42 districts, 27 declined in preliminary 2025-26 and 14 gained. Kansas City was among those that declined. In the broader set of 557 districts with published totals in both final years, 370 declined and 174 gained. Those are counts of matched districts; they do not establish the change in total statewide enrollment.
Kansas City’s endpoint count ranked second among 523 districts with published counts in 2000-01, and thirteenth among 558 with published counts in preliminary 2025-26. The memberships differ, so the ranks refer to each year’s observed records.
A different recent path from St. Louis City
St. Louis City↗ET went from 41,988 students at the starting endpoint to 15,558 at the final one, a decline of 62.9%. Both districts therefore lost more than half their reported students between the endpoints. Indexed to each district’s own starting count, Kansas City finished at 45.0 and St. Louis City at 37.1.
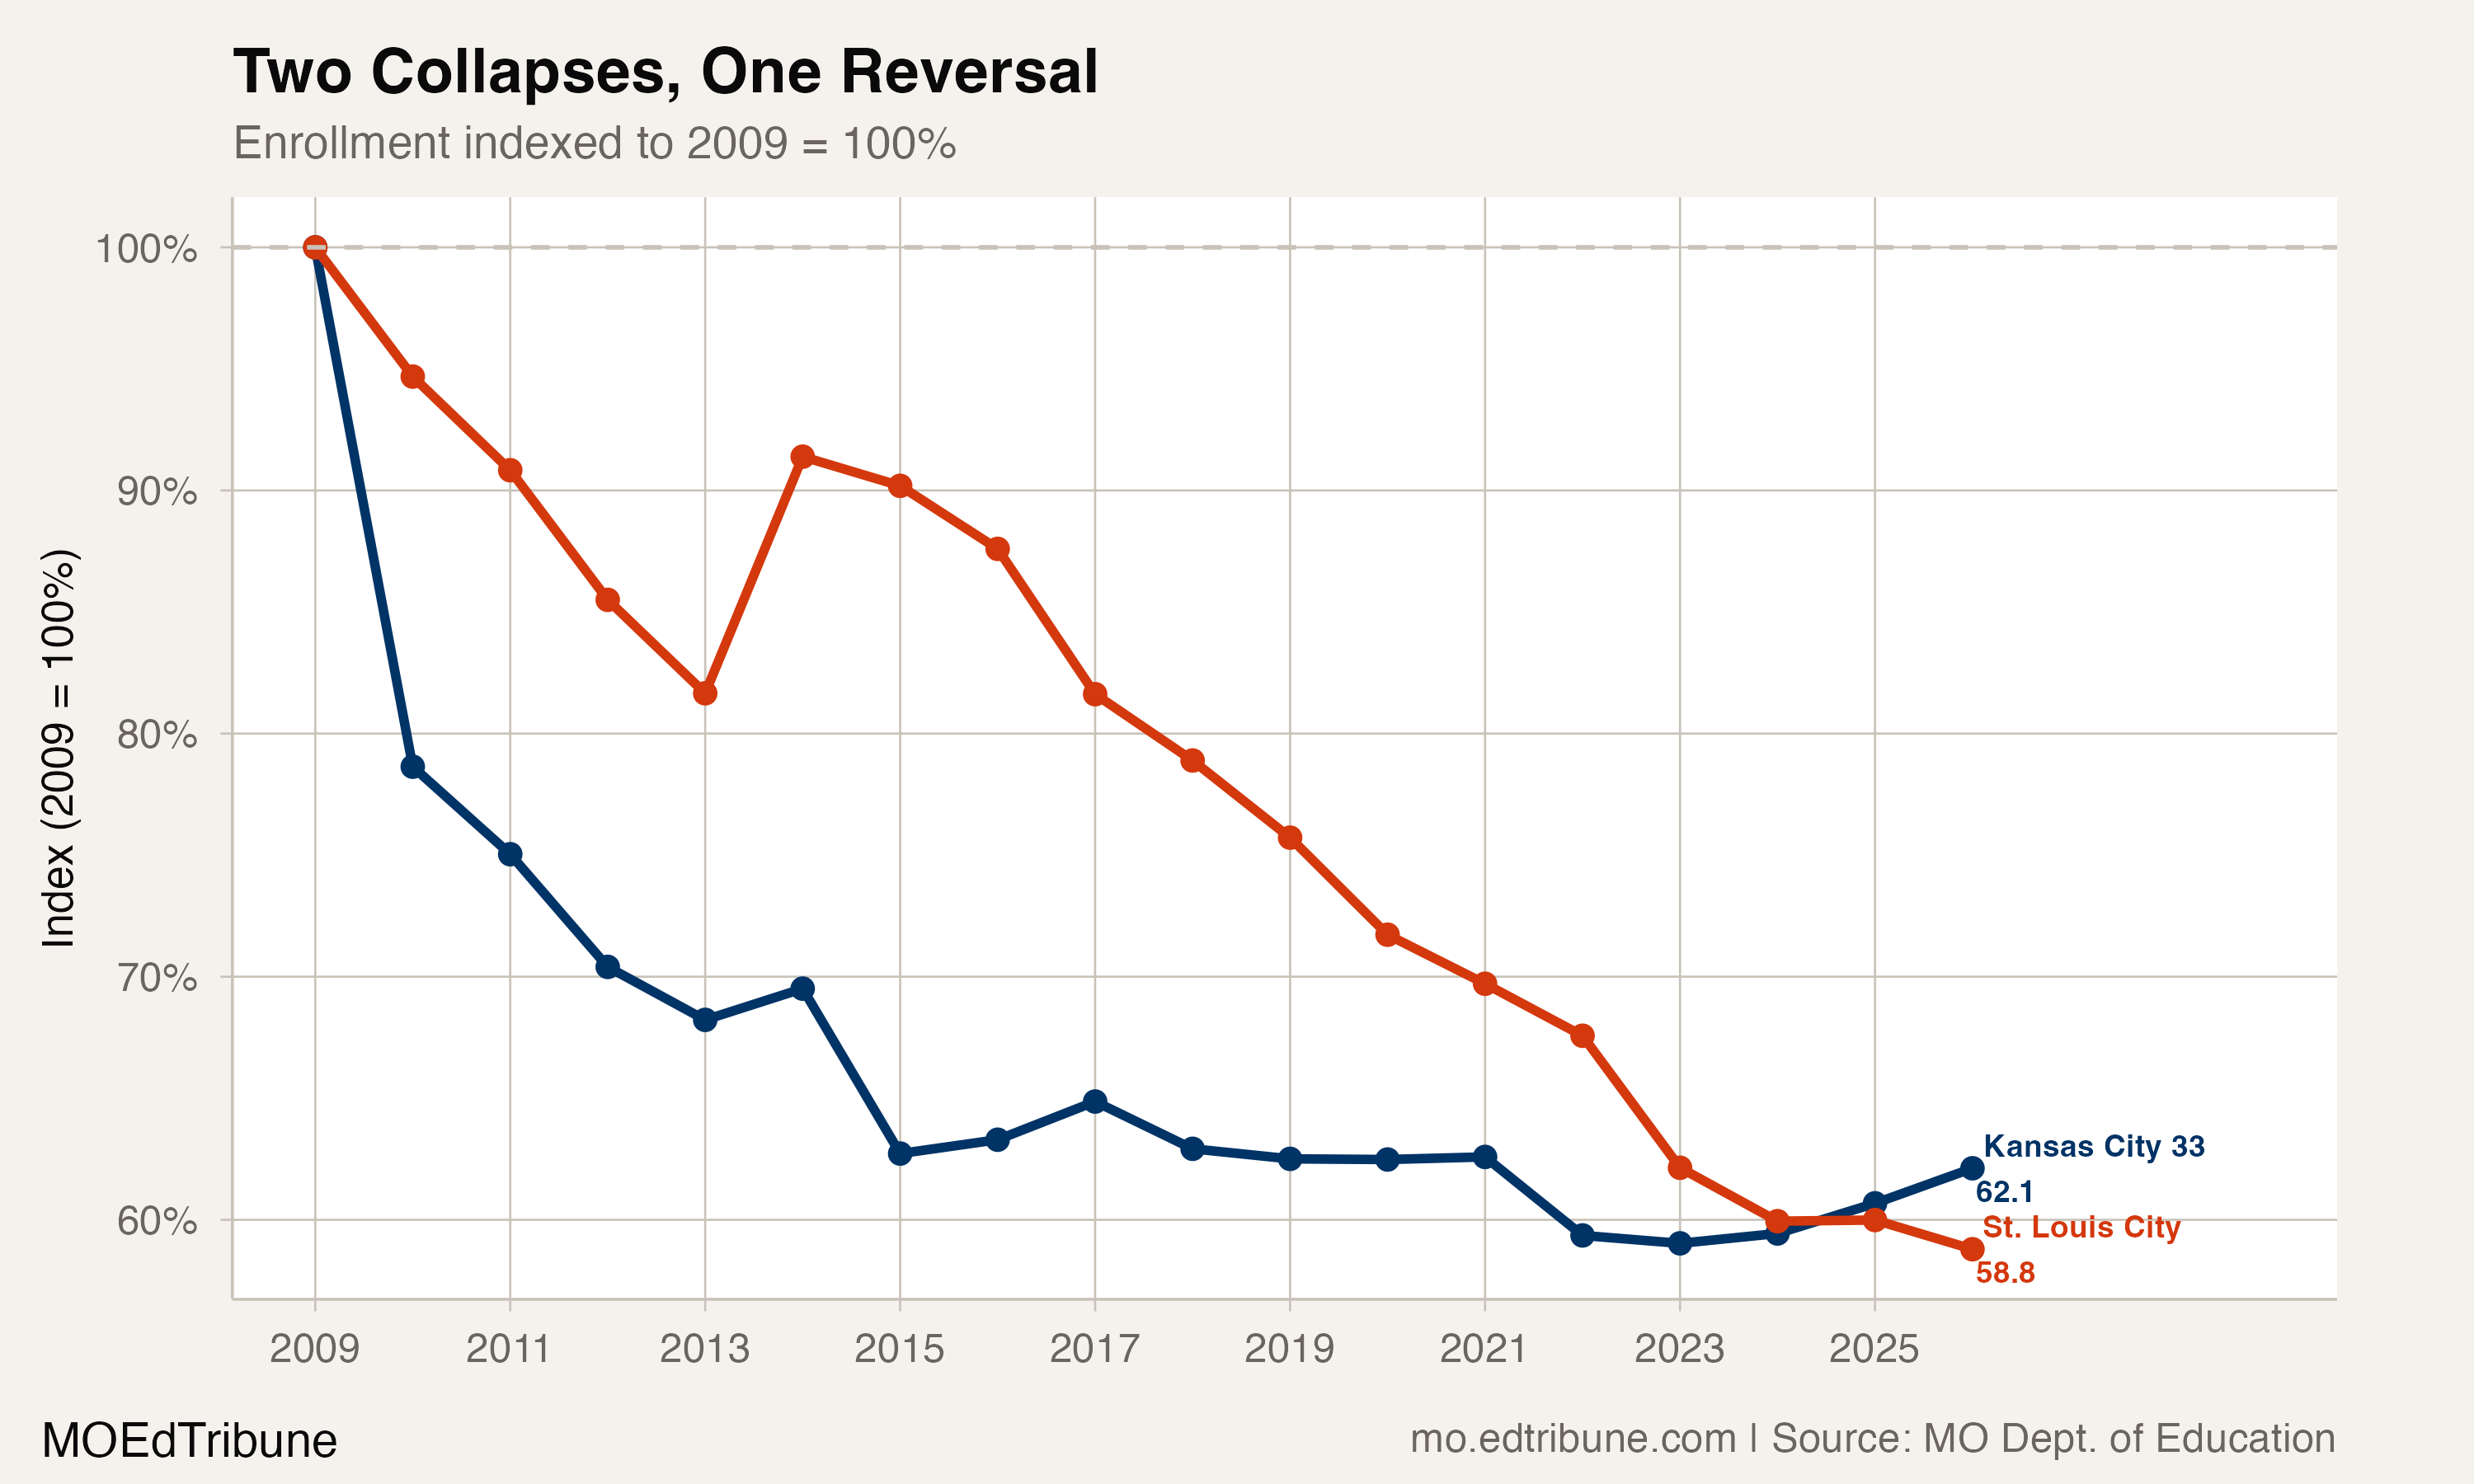
Since Kansas City’s 2021-22 low, its count gained 687 students, or 5.2%, while St. Louis City lost 1,577. St. Louis City’s final count was its lowest in the observation window. Kansas City’s average annual gain across that recent span was 172 students, rounded; the final annual comparison was a decline.
Different paths among named peers
North Kansas City Schools↗ET reported 20,754 students in preliminary 2025-26, or 6,797 more than Kansas City. Its count was 23.8% above its starting endpoint. Liberty↗ET gained 71.4% and Grain Valley↗ET gained 158.2%.
Other named districts declined: Hickman Mills↗ET by 34.2%, Center↗ET by 16.4% and Raytown↗ET by 15.0%. The chart uses the eleven named districts listed on its axis; it is not a complete metropolitan census. Their different changes do not show where students moved.
English learner enrollment in the demographic file
The state’s district demographic file reported 2,898 current English learners in Kansas City’s kindergarten-through-12th-grade population in 2021-22, or 21.8% of its published K12 enrollment. In 2024-25, the most recent demographic year available in this source, it reported 3,803, or 27.2%. Each share uses the published K12 enrollment total from that same demographic row, and those denominators agree with the district enrollment files for the corresponding years.
The English learner count rose by 905 between those years, while the district’s K12 enrollment rose by 694. These are net changes in reported categories. They do not count immigrants or establish which students arrived, left or changed classification, and they do not explain the district’s enrollment gains.
What people said at the time
KCUR’s report on schools receiving new students quoted George Melcher Elementary principal LaKeisha Paul: "Right now, we're just trying to get them in, let them know that they're safe, feed them lunch and start planning for next year."
In that same report, Deputy Superintendent Derald Davis described the planning implications:
"It lessens the chance that we need to consider any consolidations. If schools are filling up and bursting at the seams, we'll actually have to have a different conversation around possibly opening up another school." Source: KCUR
After voters approved a school building bond, Superintendent Jennifer Collier told KCUR: "We have now ushered Kansas City into a new era."
Those are attributed perspectives from the cited reports. The annual enrollment files do not establish the effects of that bond or demonstrate which families caused the recent gains. They support a narrower finding: Kansas City had three annual gains following its observed low, then a small preliminary decline.
Enrollment figures come from the Missouri Department of Elementary and Secondary Education’s district and building enrollment files. Counts for 2025-26 are preliminary. Exact statewide totals and statewide shares are unavailable on the compatible source basis used here. English learner figures use the district demographic file’s current EL K12 rows and their own published K12 denominators; they are not an immigrant count.
Detailed code that reproduces the analysis and figures in this article is available exclusively to EdTribune subscribers.
Discussion
Sign in to join the discussion.
Loading comments...