Correction (October 8, 2026): This article’s district counts have been reverified on the state’s retained enrollment files. We have withdrawn the statewide enrollment shares and share-of-state-loss calculation because an exact compatible statewide total is unavailable. We also withdrew the early charter total and comparisons built on it: a charter count in the original workbook is suppressed. Reported changes between district and charter columns do not, by themselves, prove that particular students transferred or establish why enrollment changed. The comparisons below name their observation windows and reporting limits.
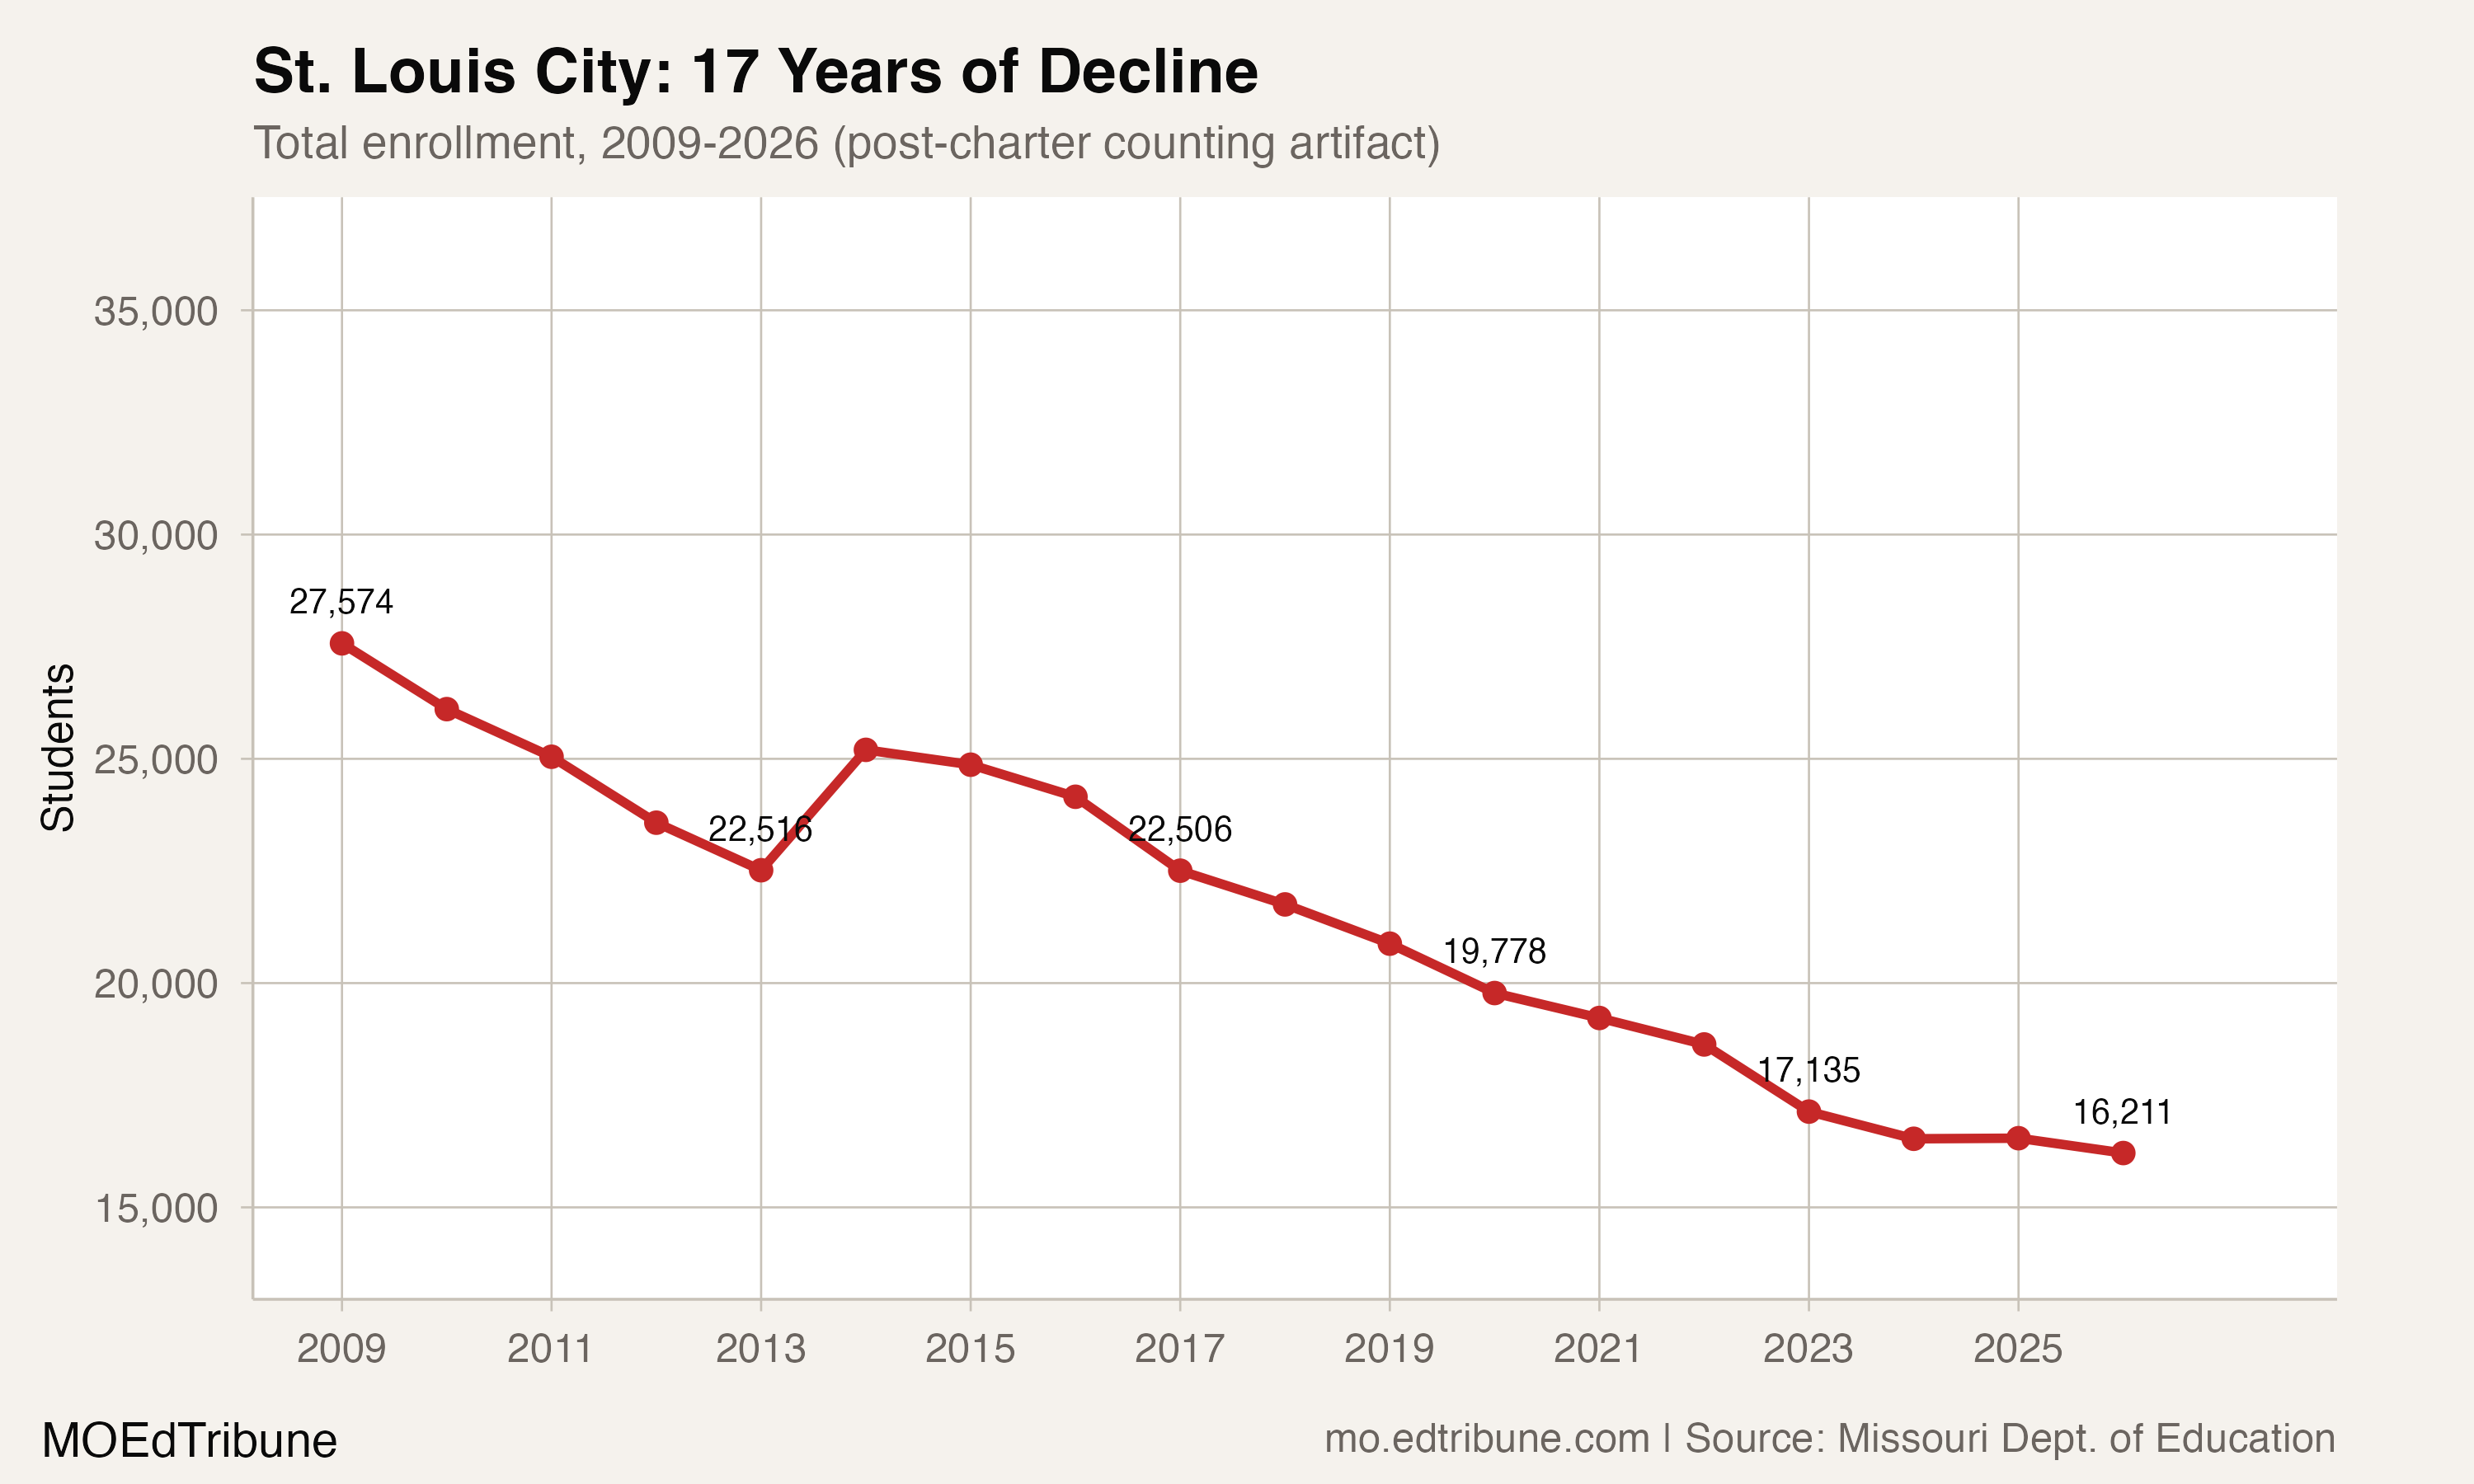
St. Louis City↗ET reported 15,558 students in preliminary 2025-26, last school year and the most recent year in these published enrollment files. Its count was 41,988 in 2000-01: a decline of 26,430 students, or 62.9%.
That is the largest absolute decline among the 516 districts with published counts at both endpoints. Among the 33 matched districts that reported at least 5,000 students at the starting endpoint, it is also the largest percentage decline. These comparisons use each district’s published kindergarten-through-12th-grade total, excluding preschool; they do not estimate missing district counts.
In January, the state board lowered the district’s accreditation to provisional status. That reported decision supplies context; the enrollment files do not show its effect on families’ school choices.
Schools with reported enrollment
The files contain 117 distinct district school identifiers with positive reported enrollment in 2000-01 and 62 in preliminary 2025-26, a difference of 55. These are counts of school records with reported students. They are not a physical building inventory or a count of closures, and they cannot be used to calculate how many buildings would remain after a proposed closure plan.
What the annual observations establish
The district’s two largest observed annual losses were 3,226 students in 2006-07 and 4,561 in 2007-08. Its largest observed gain was 2,684 in 2012-13. The original charter file also shows three charter entities with a combined 3,865 students in 2011-12 that do not appear in the following year’s charter rows. The complete reported charter total declined 2,987 in that comparison, and the sum of the district and those charter totals declined 303.
Those simultaneous changes do not show which, if any, students moved between the reported agencies. They are not a student-level transfer record, so this article no longer describes the district’s gain as a proved reclassification of those students.
From the published 2007-08 district count to preliminary 2025-26, St. Louis City declined 12,016 students, or 43.6%. Of the 18 annual transitions in that span, 16 were losses. Across the full stated district window, 23 of 25 transitions were losses. The other recent gain was 13 students in 2023-24; the preliminary 2025-26 change was a loss of 654.
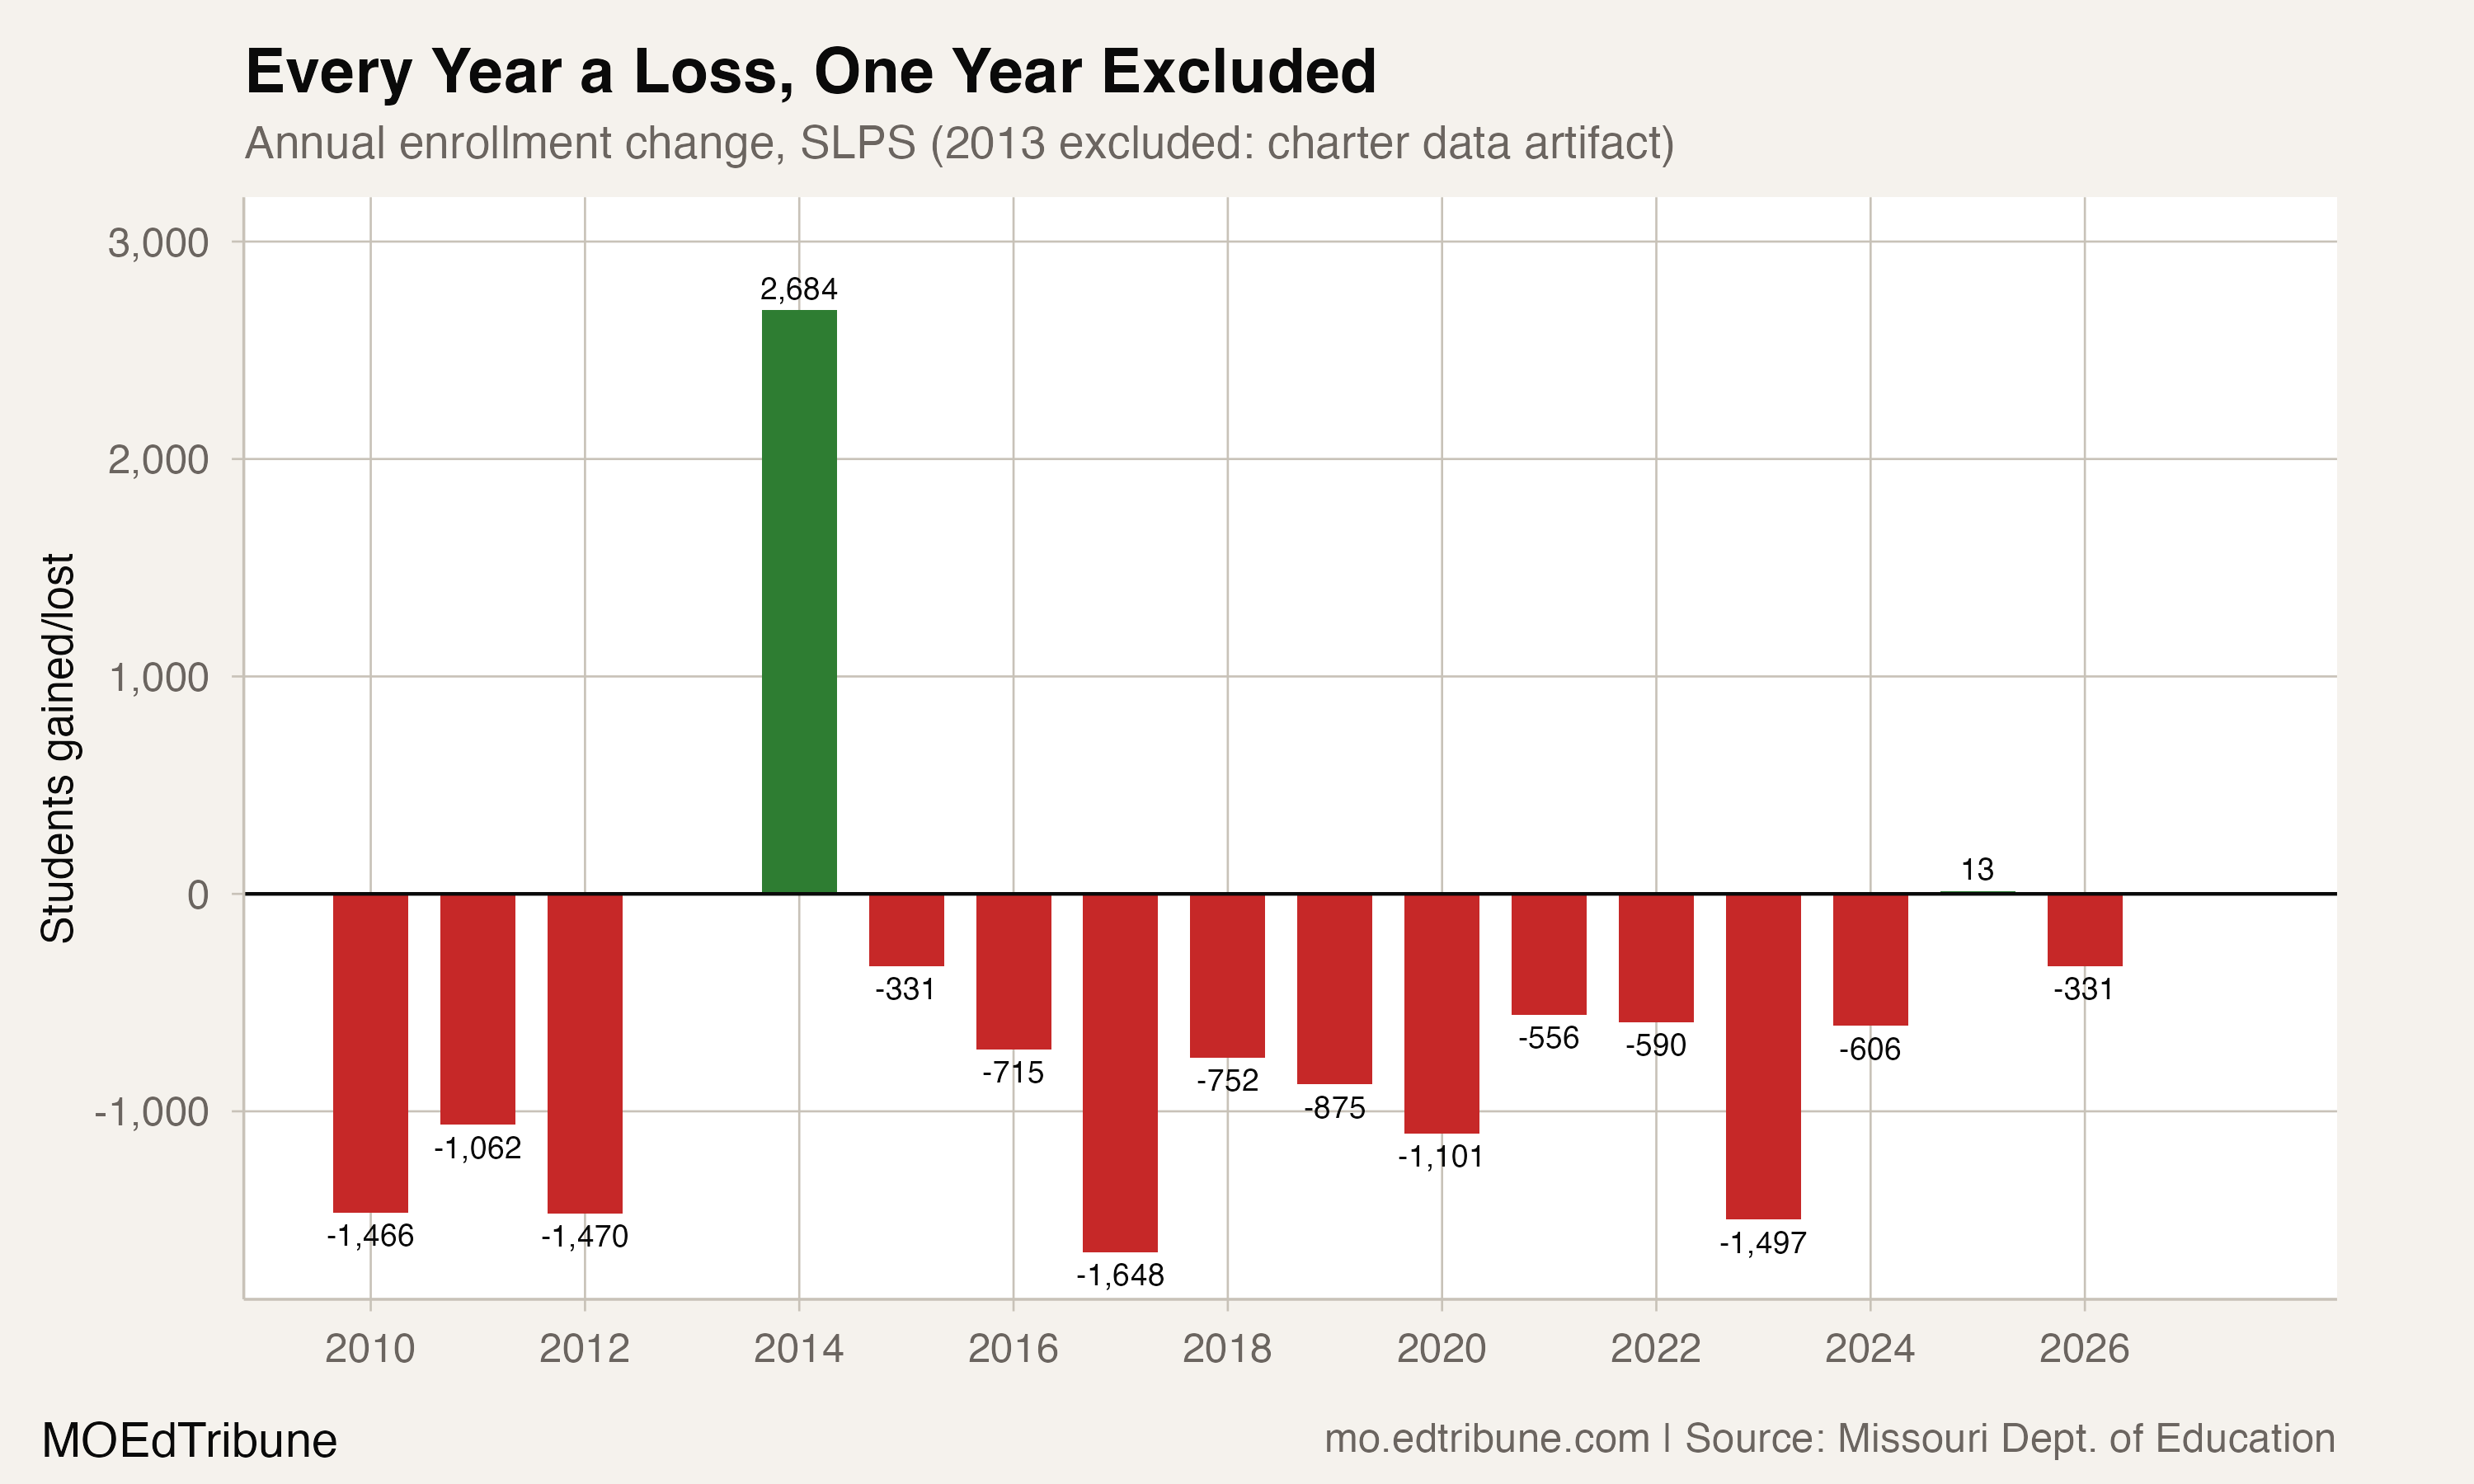
The average annual loss was 451 students from 2007-08 to 2013-14, 941 from 2013-14 to 2019-20, and 611 from 2019-20 to preliminary 2025-26. The corresponding compound annual percentage losses in the latter two intervals were 4.2% and 3.5%. Those calculations describe the reported endpoints; they do not explain the changes.
A bounded charter comparison
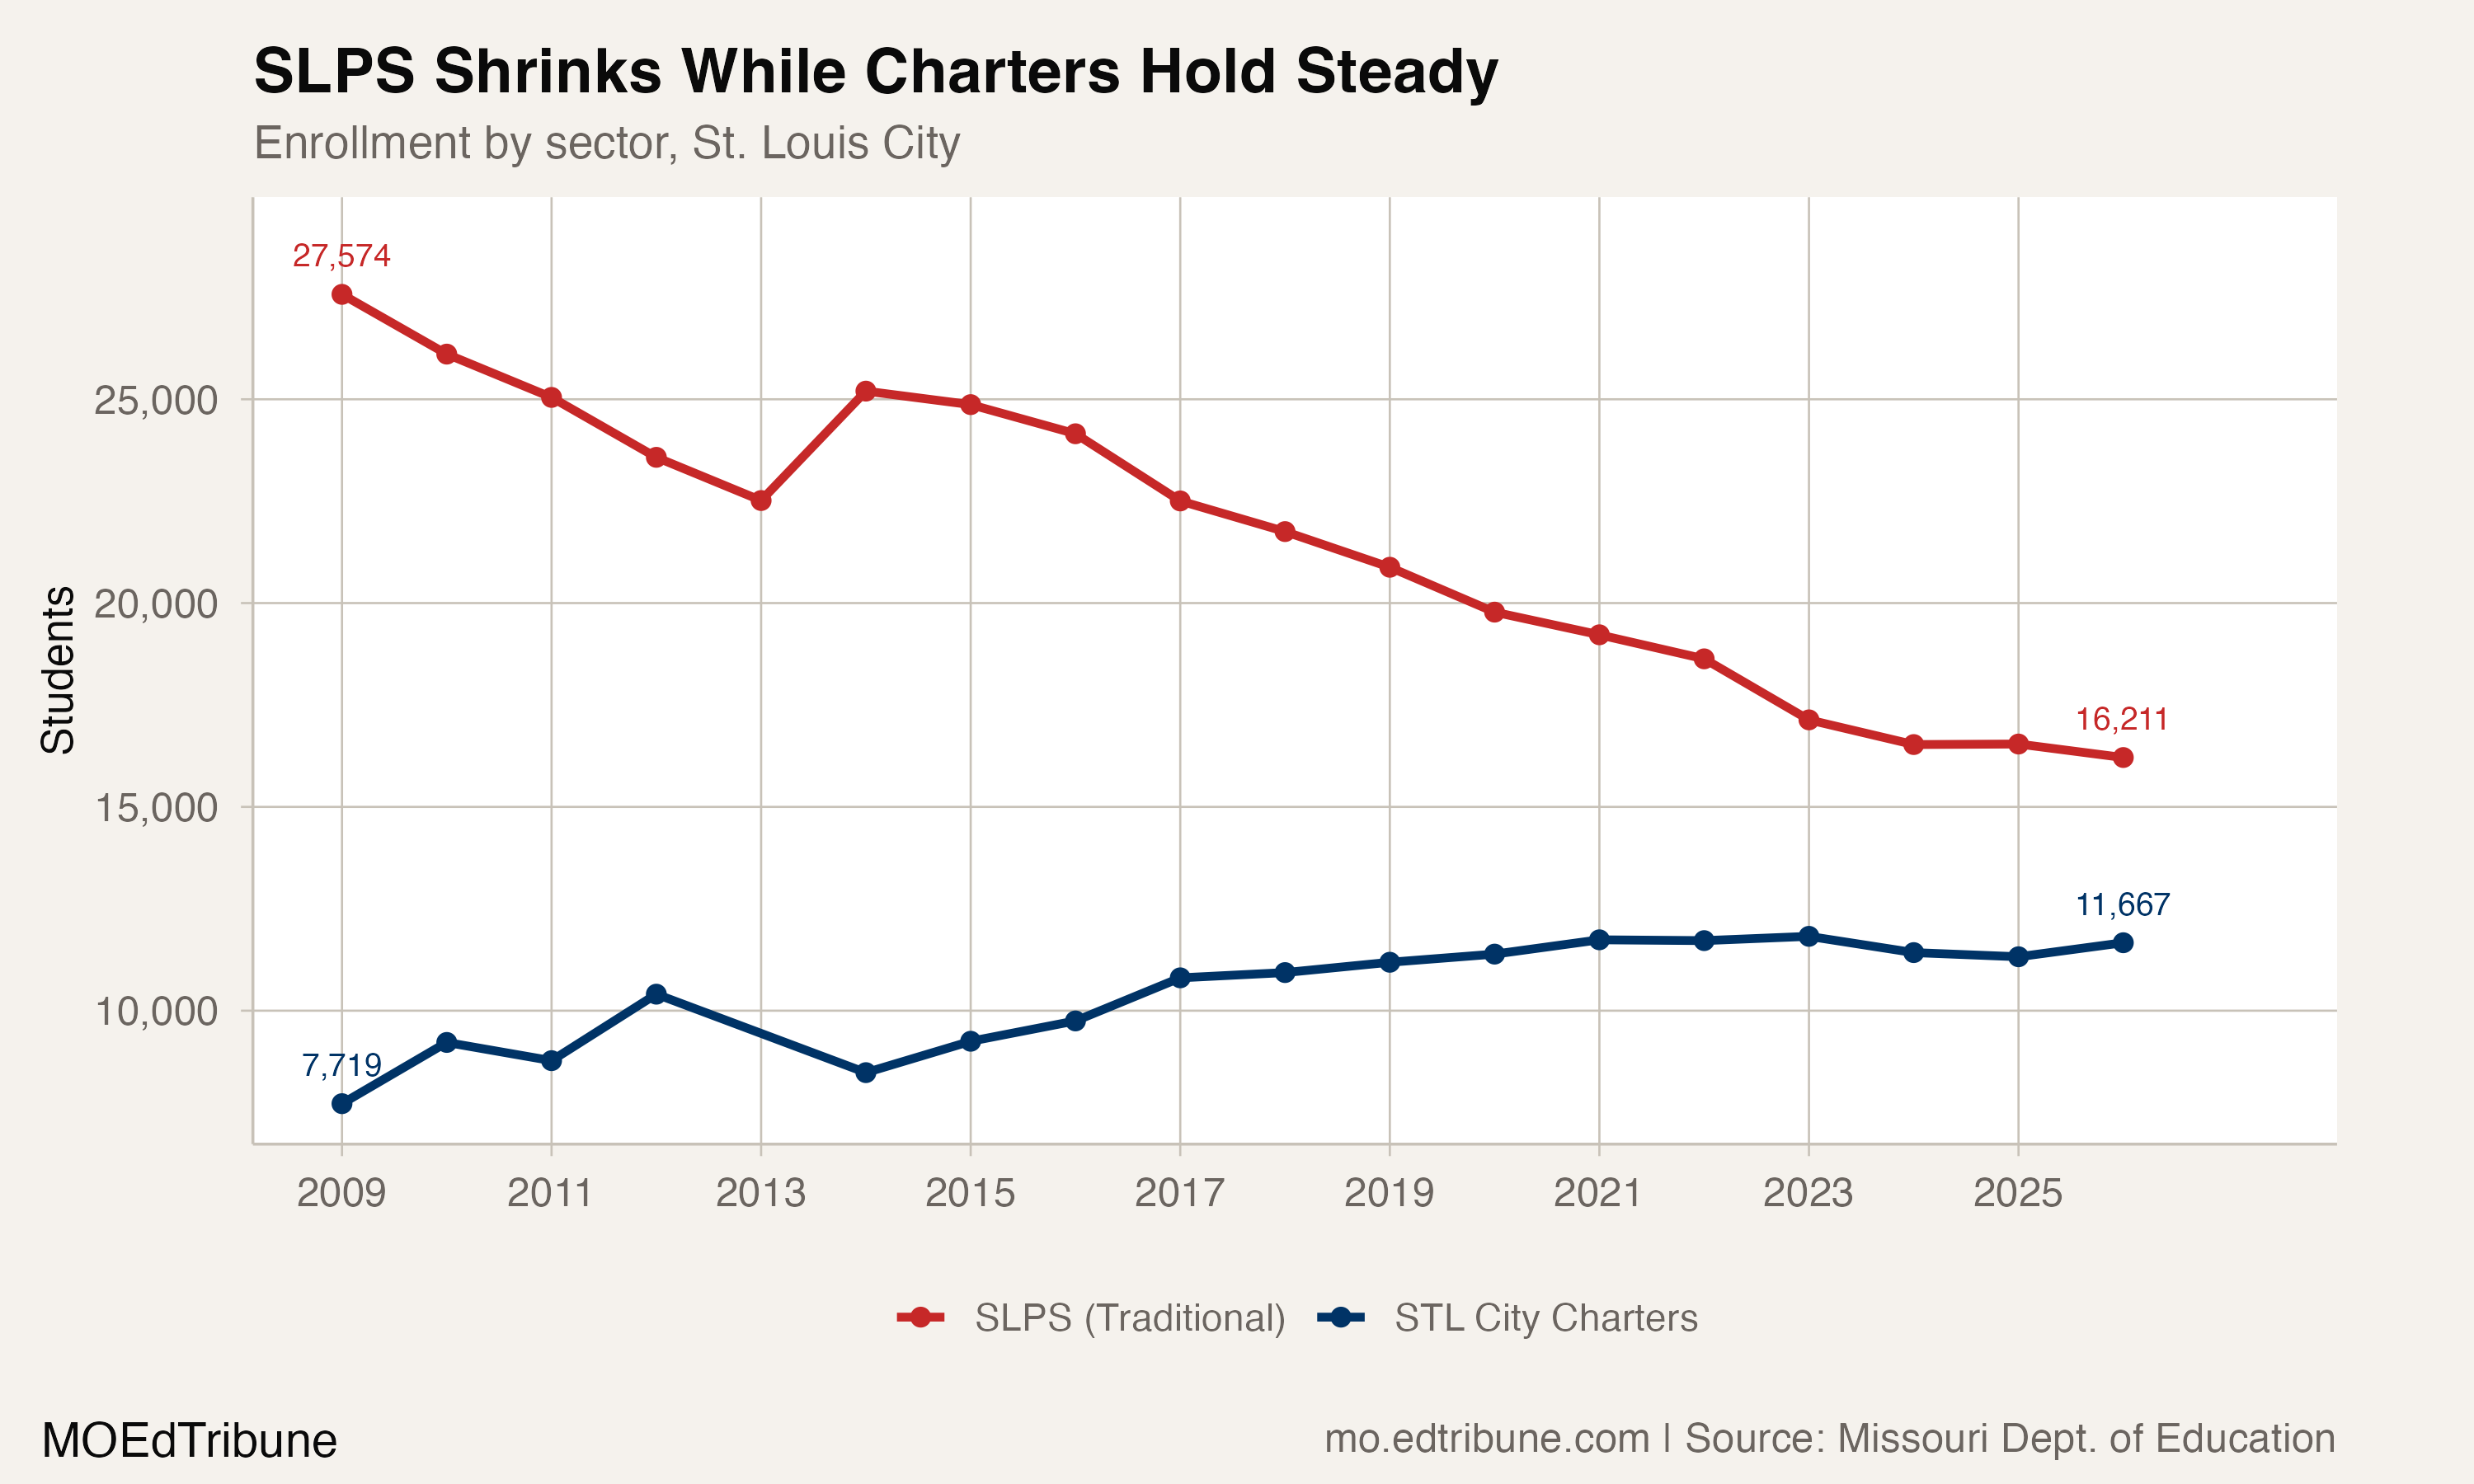
The early charter total is unavailable because the original file contains a suppressed count. The complete comparison here starts in 2008-09 and ends in preliminary 2025-26. It covers charter local education agencies in the state’s St. Louis City county-code block, rather than every public school or every student living in the city.
Those charter agencies reported 9,221 K12 students in 2008-09 and 12,097 across 17 agencies in preliminary 2025-26, an increase of 31.2%. The final charter total is the highest among the 18 complete annual observations in this stated window. Adding the district and those charter totals produces 35,329 at the first endpoint and 27,655 at the last, a decline of 7,674. No missing charter count is treated as zero, and the earlier suppressed observation is not used as a baseline.
Kansas City’s recent path differs
Kansas City Public Schools↗ET lost 17,069 students between the full district window’s endpoints, a 55.0% decline. Its recent annual changes were gains of 91, 279 and 324 students in 2022-23, 2023-24 and 2024-25, followed by a preliminary loss of seven in 2025-26. Across those same four annual transitions, Kansas City added 687 students while St. Louis City lost 1,577.
With each district’s published 2007-08 count indexed to the same starting value, Kansas City’s preliminary endpoint is 62.1 and St. Louis City’s is 56.4. This compares district reporting histories; it does not establish that their enrollment boundaries or charter arrangements were identical.
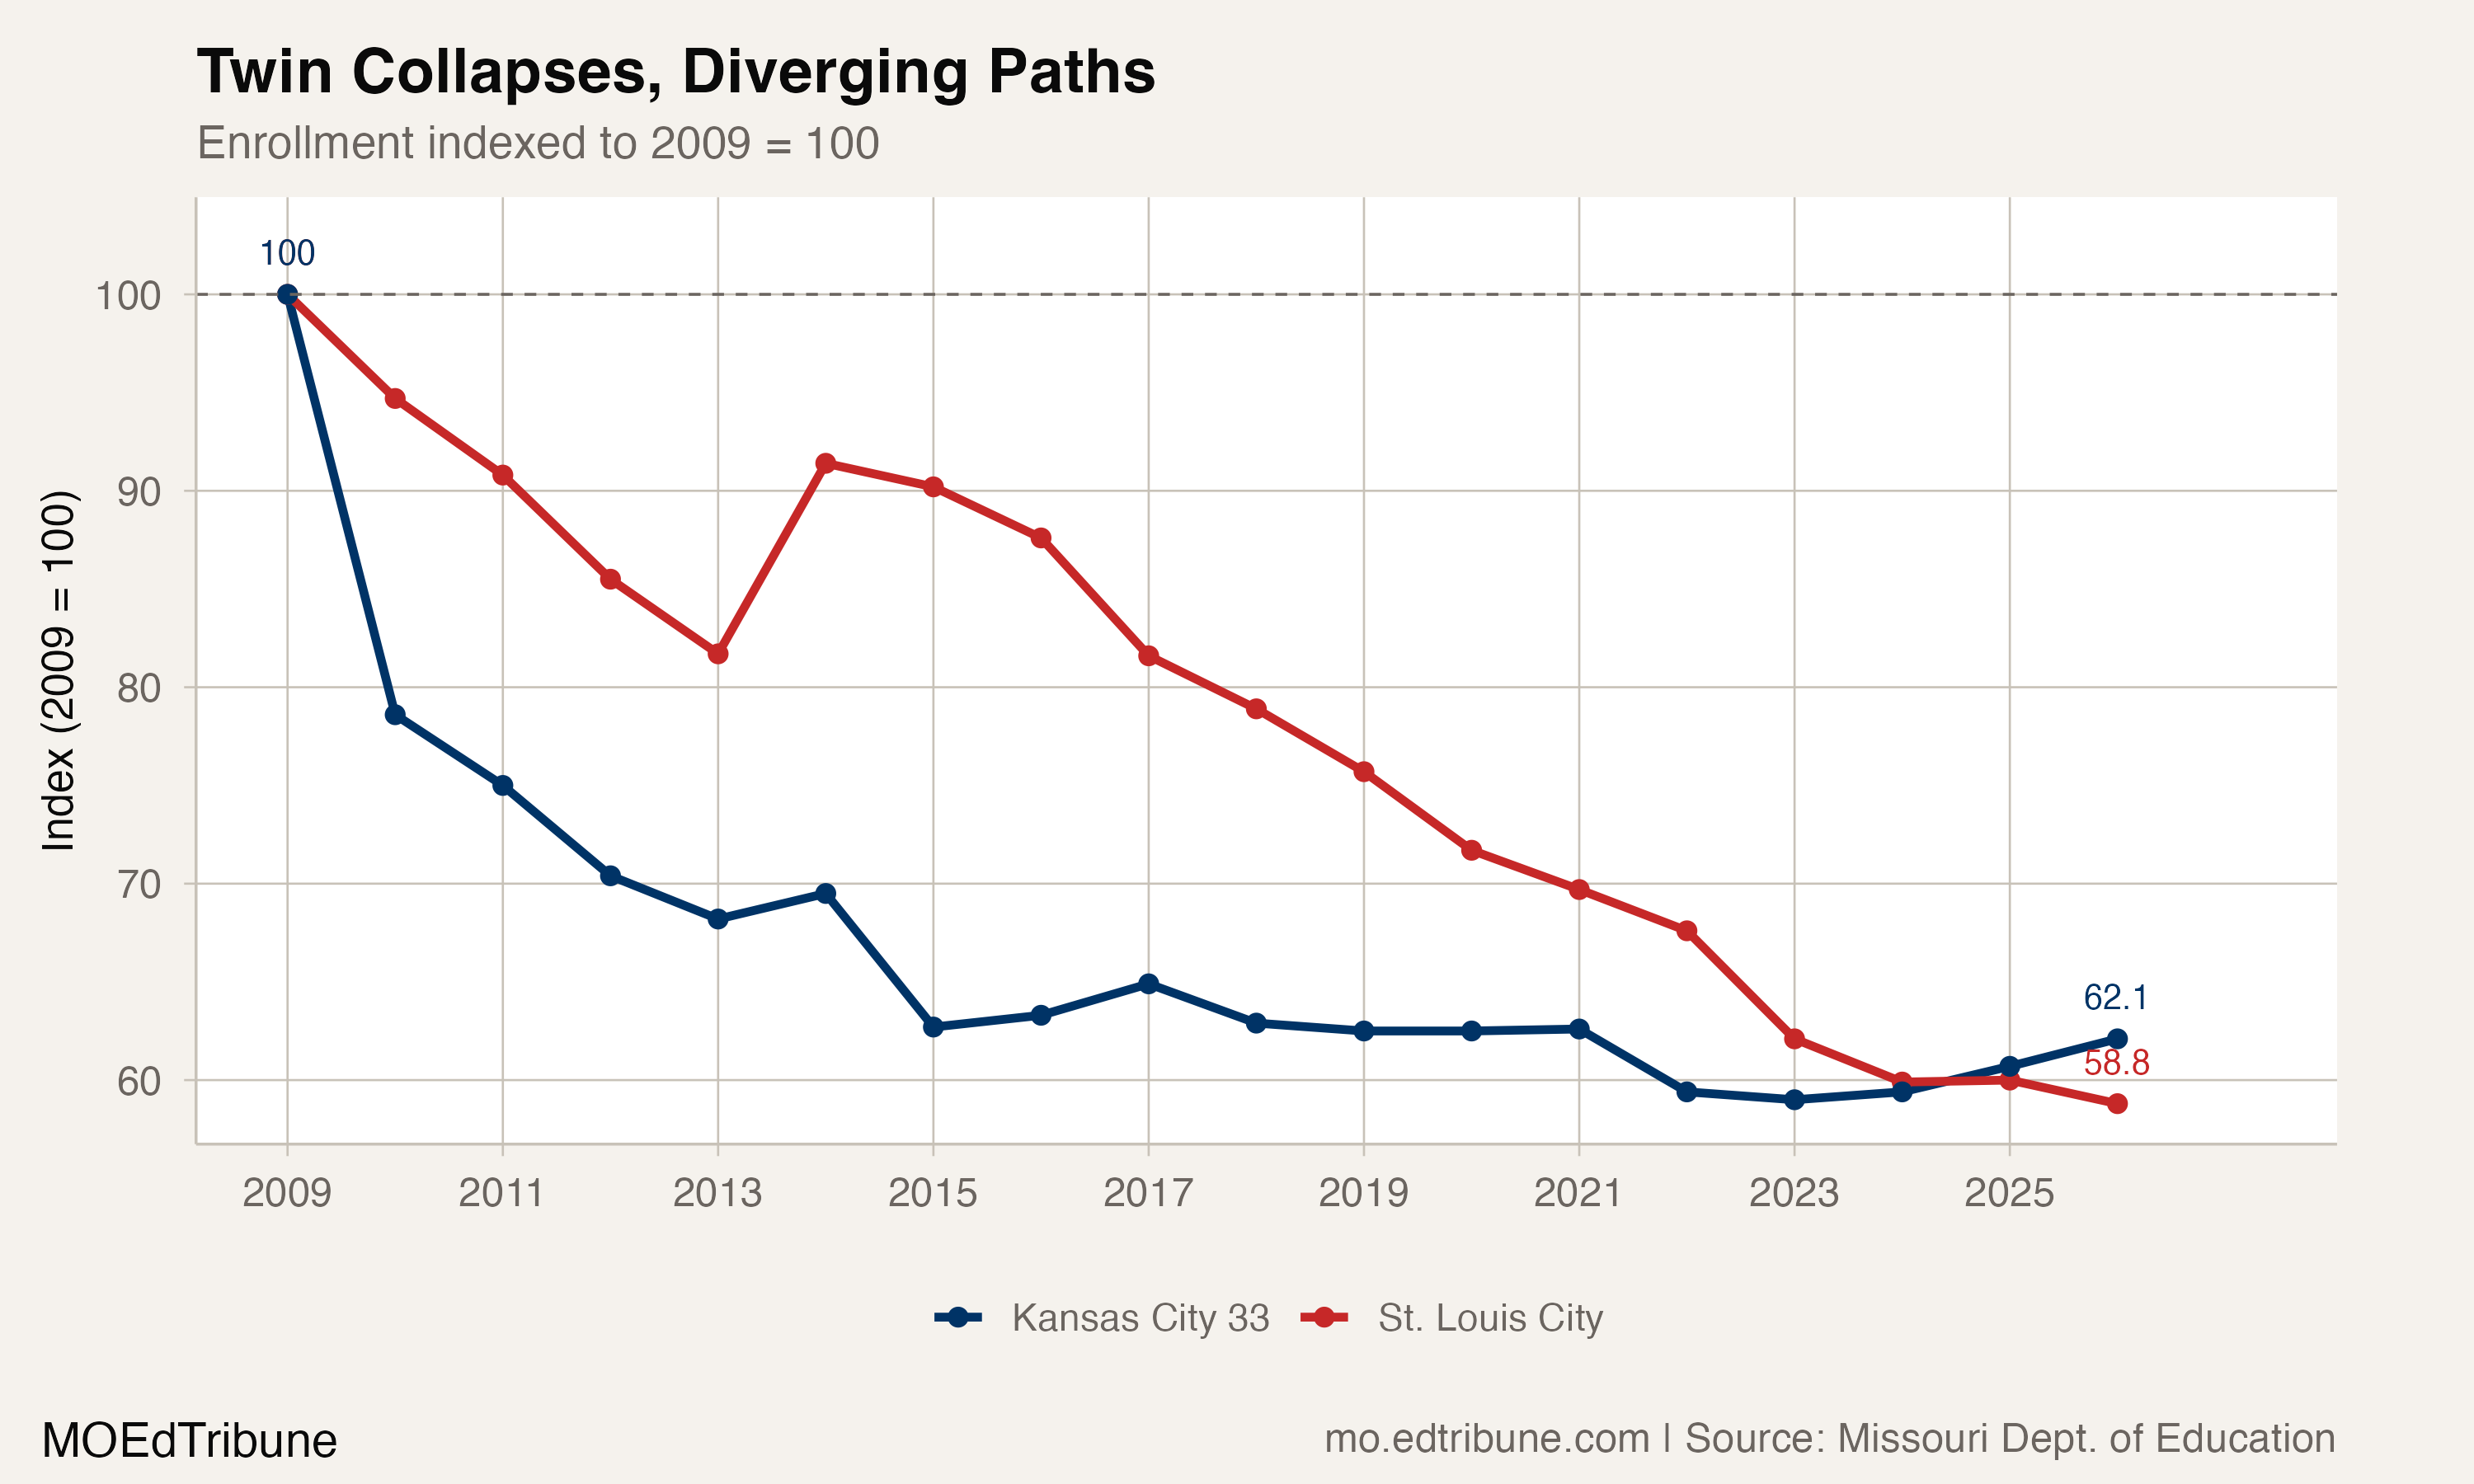
The data do not isolate the causes of these changes. In an interview about the city’s population, Ness Sandoval offered a broader regional perspective:
"St. Louis city is the principal city of the region. It is the brand of the region. If the region is going to recover and grow, the prerequisite is that St. Louis needs to recover and grow." Ness Sandoval, St. Louis University, STLPR, May 2025
That attributed perspective is context. It does not turn the enrollment series into evidence that a particular demographic, governance or school-choice mechanism caused the district’s losses.
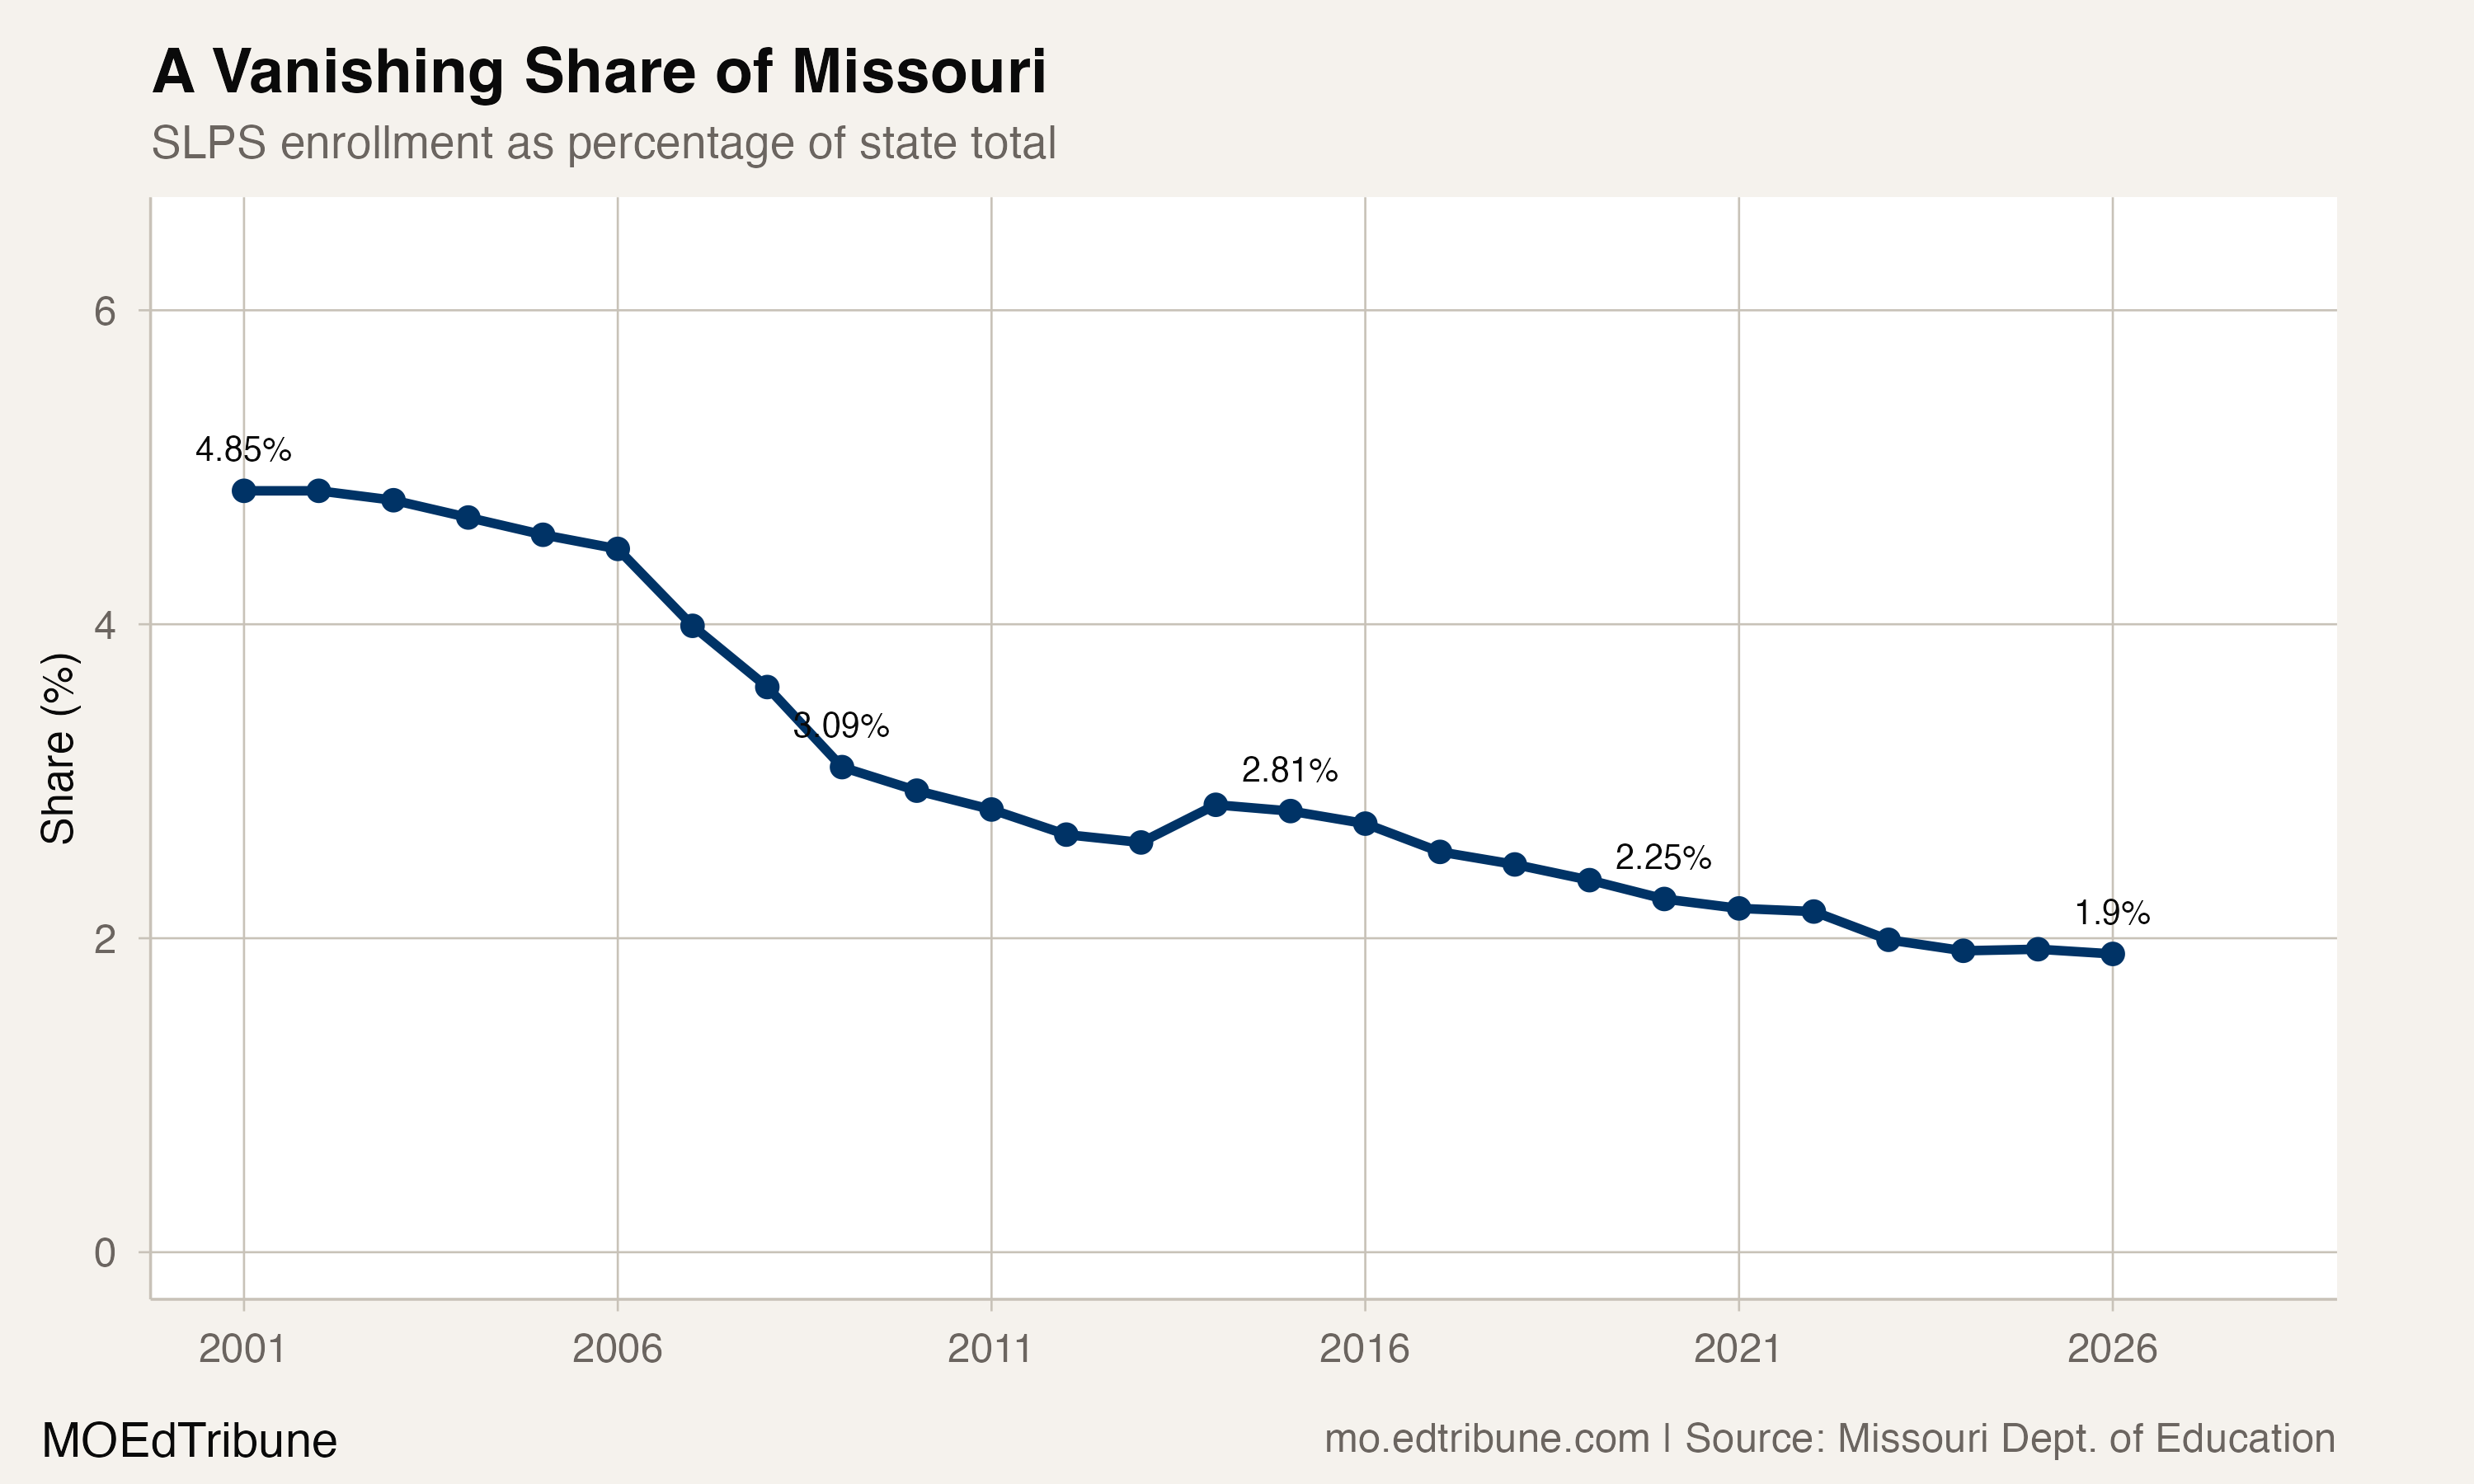
Enrollment figures come from the Missouri Department of Elementary and Secondary Education’s district and building enrollment files. Counts for 2025-26 are preliminary. Statewide shares remain unavailable on this consistent district source basis.
Detailed code that reproduces the analysis and figures in this article is available exclusively to EdTribune subscribers.
Discussion
Sign in to join the discussion.
Loading comments...