Correction (October 8, 2026): This version matches districts by their native state identifiers across name changes. That adds previously split records to the comparison and revises the recovery counts and deficit. Earlier statewide totals, statewide decline rankings and the statewide linear benchmark have been withdrawn: suppressed enrollment cells prevent an exact compatible statewide aggregate. Earlier causal explanations and forecasts remain withdrawn. “Recovery” below means reaching a reported baseline count, not proof that pandemic effects have ended.
Rockwood↗ET reported 20,897 students in 2018-19 and 18,595 in preliminary 2025-26, a decline of 2,302. Last school year’s published kindergarten-through-12th-grade count remained below its baseline.
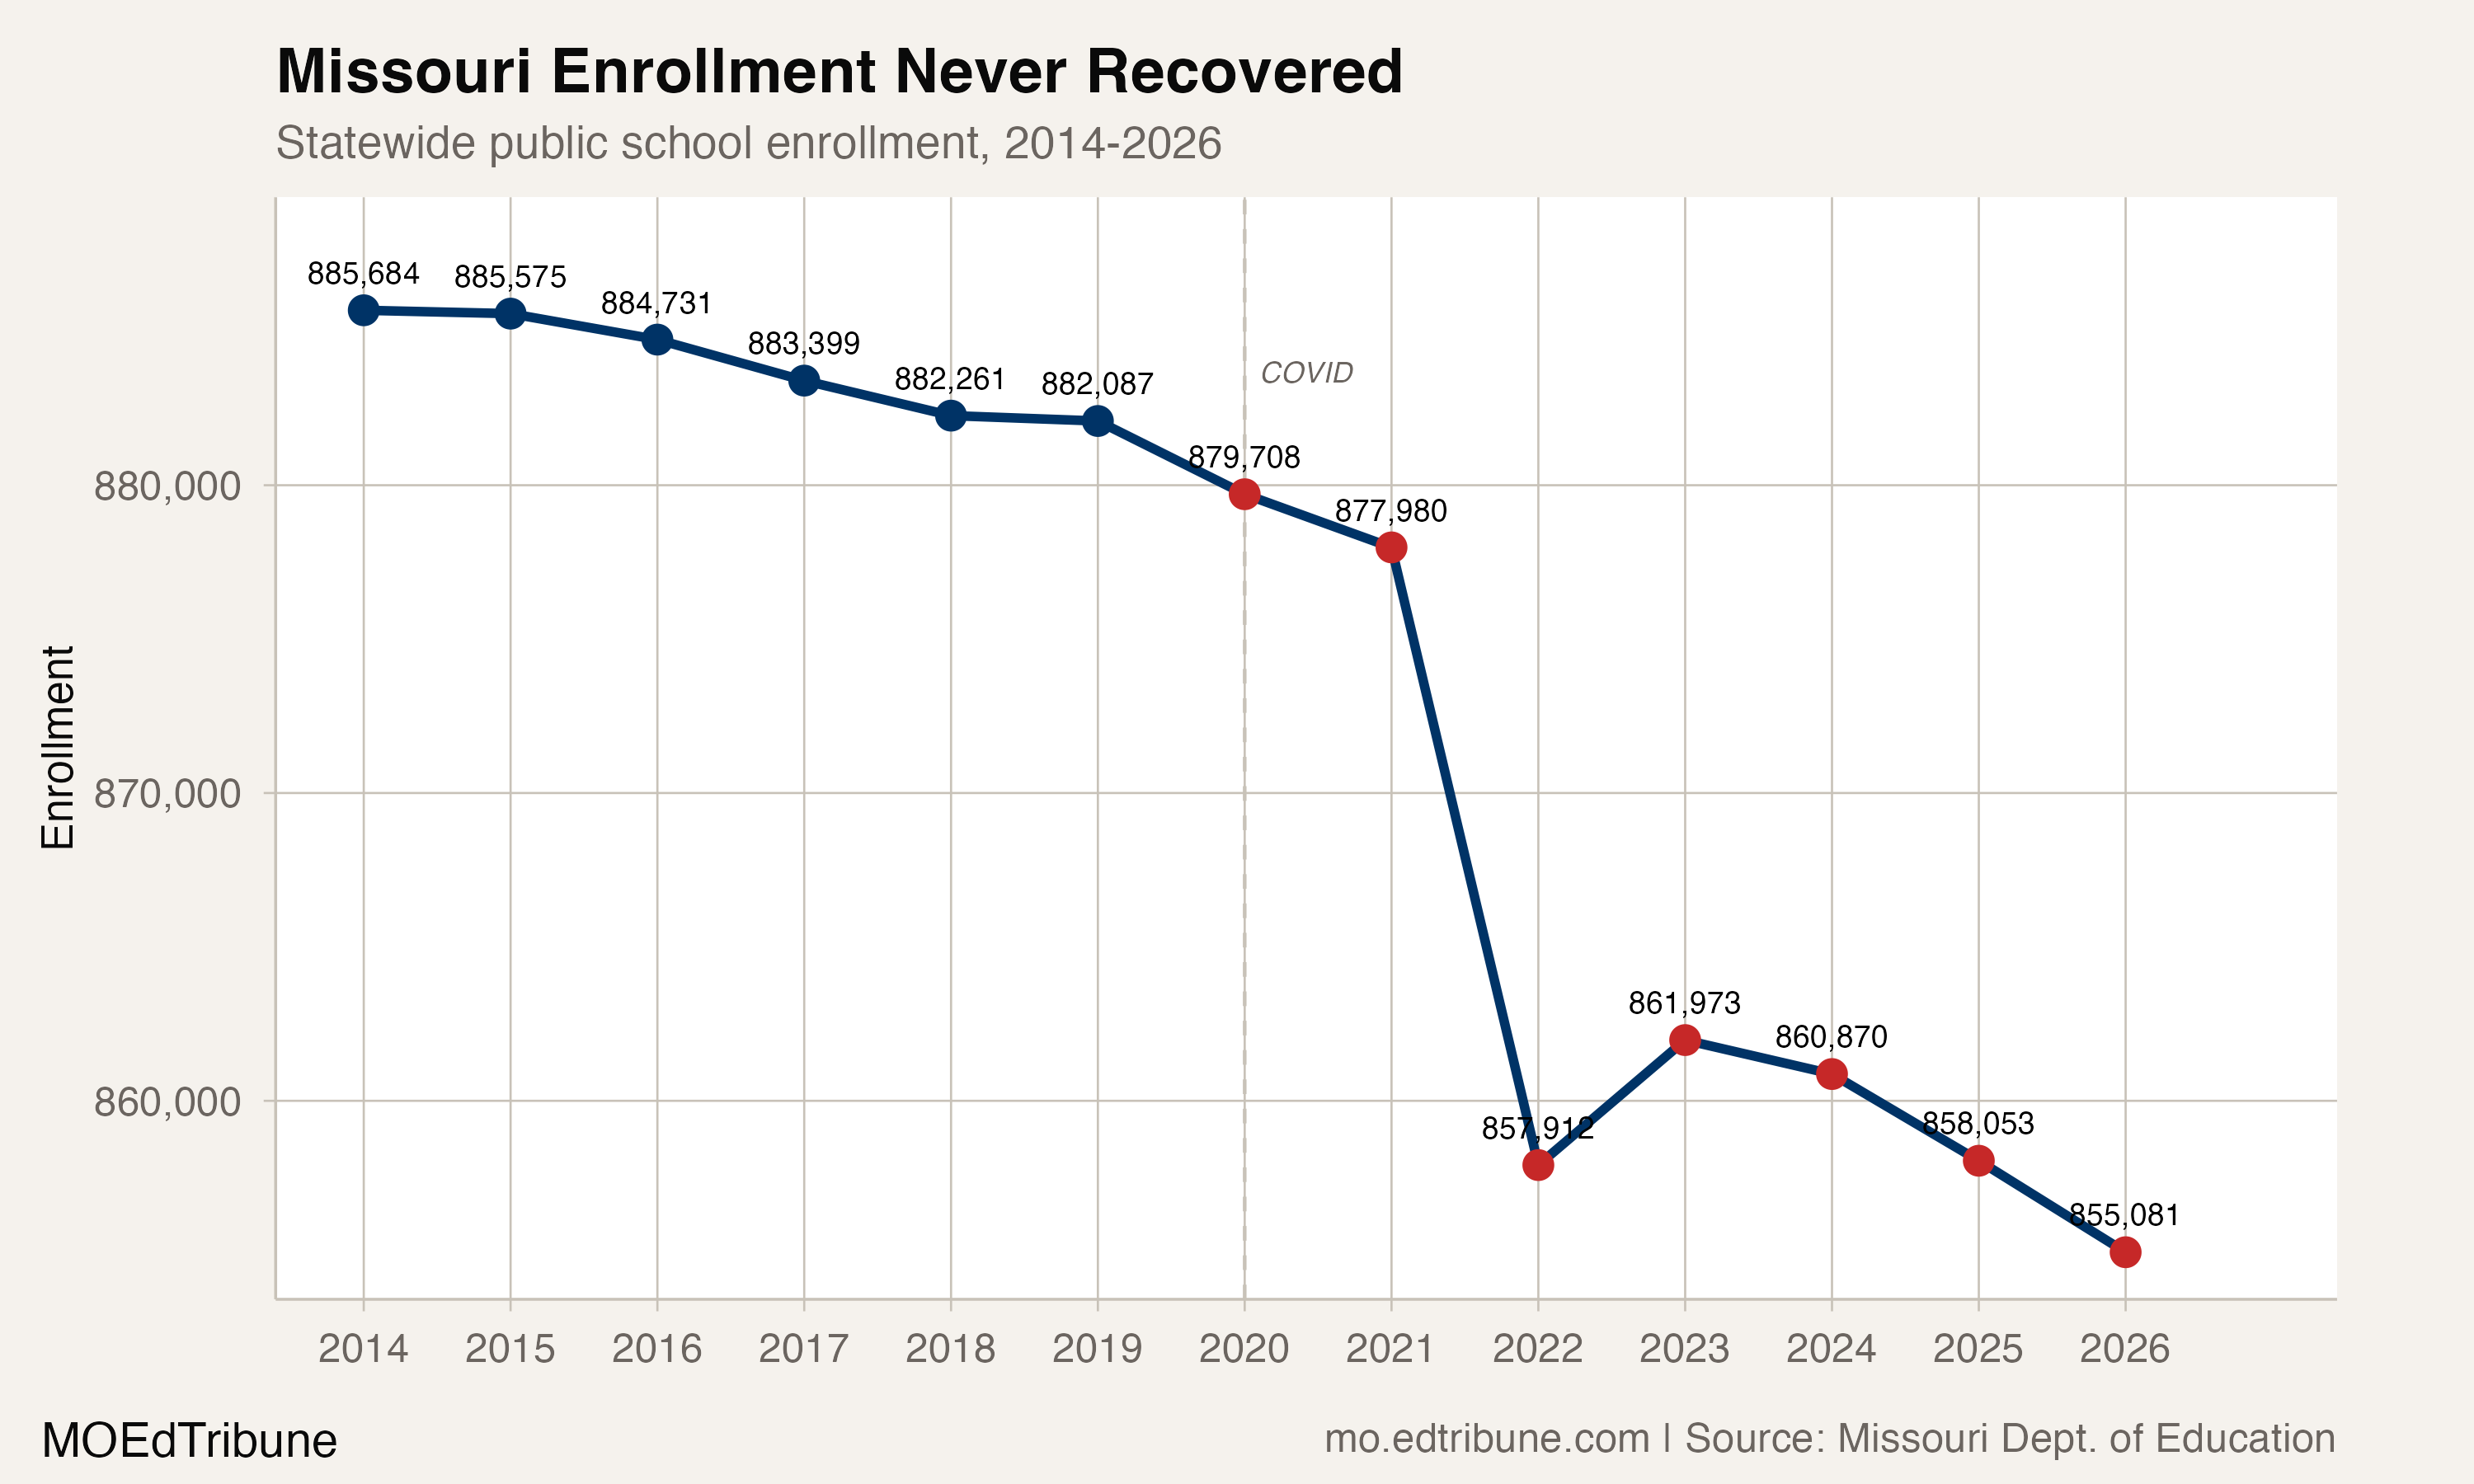
Among 550 Missouri district records with published positive K12 totals at both endpoints, 159 met or exceeded their 2018-19 counts. The other 391 were below baseline. The recovery share was 28.9%, and the below-baseline records had a combined deficit of 55,852 students. That deficit describes this matched comparison, not a statewide net loss: it excludes gains in other records and agencies outside the matched panel.
The state’s native identifiers keep renamed records together. Every district in this endpoint panel also has a published positive total in each intervening year, so the recovery curve uses the same membership throughout. These reported records include district and charter agencies; they do not establish an unchanged population of resident children.
Below baseline after the initial drop
In the separate comparison of 2019-20 with 2020-21, 398 of 557 district records with published positive totals in both years declined, or 71.5%. This is a count of declining records. It cannot establish the exact statewide annual loss or rank that loss against other years.
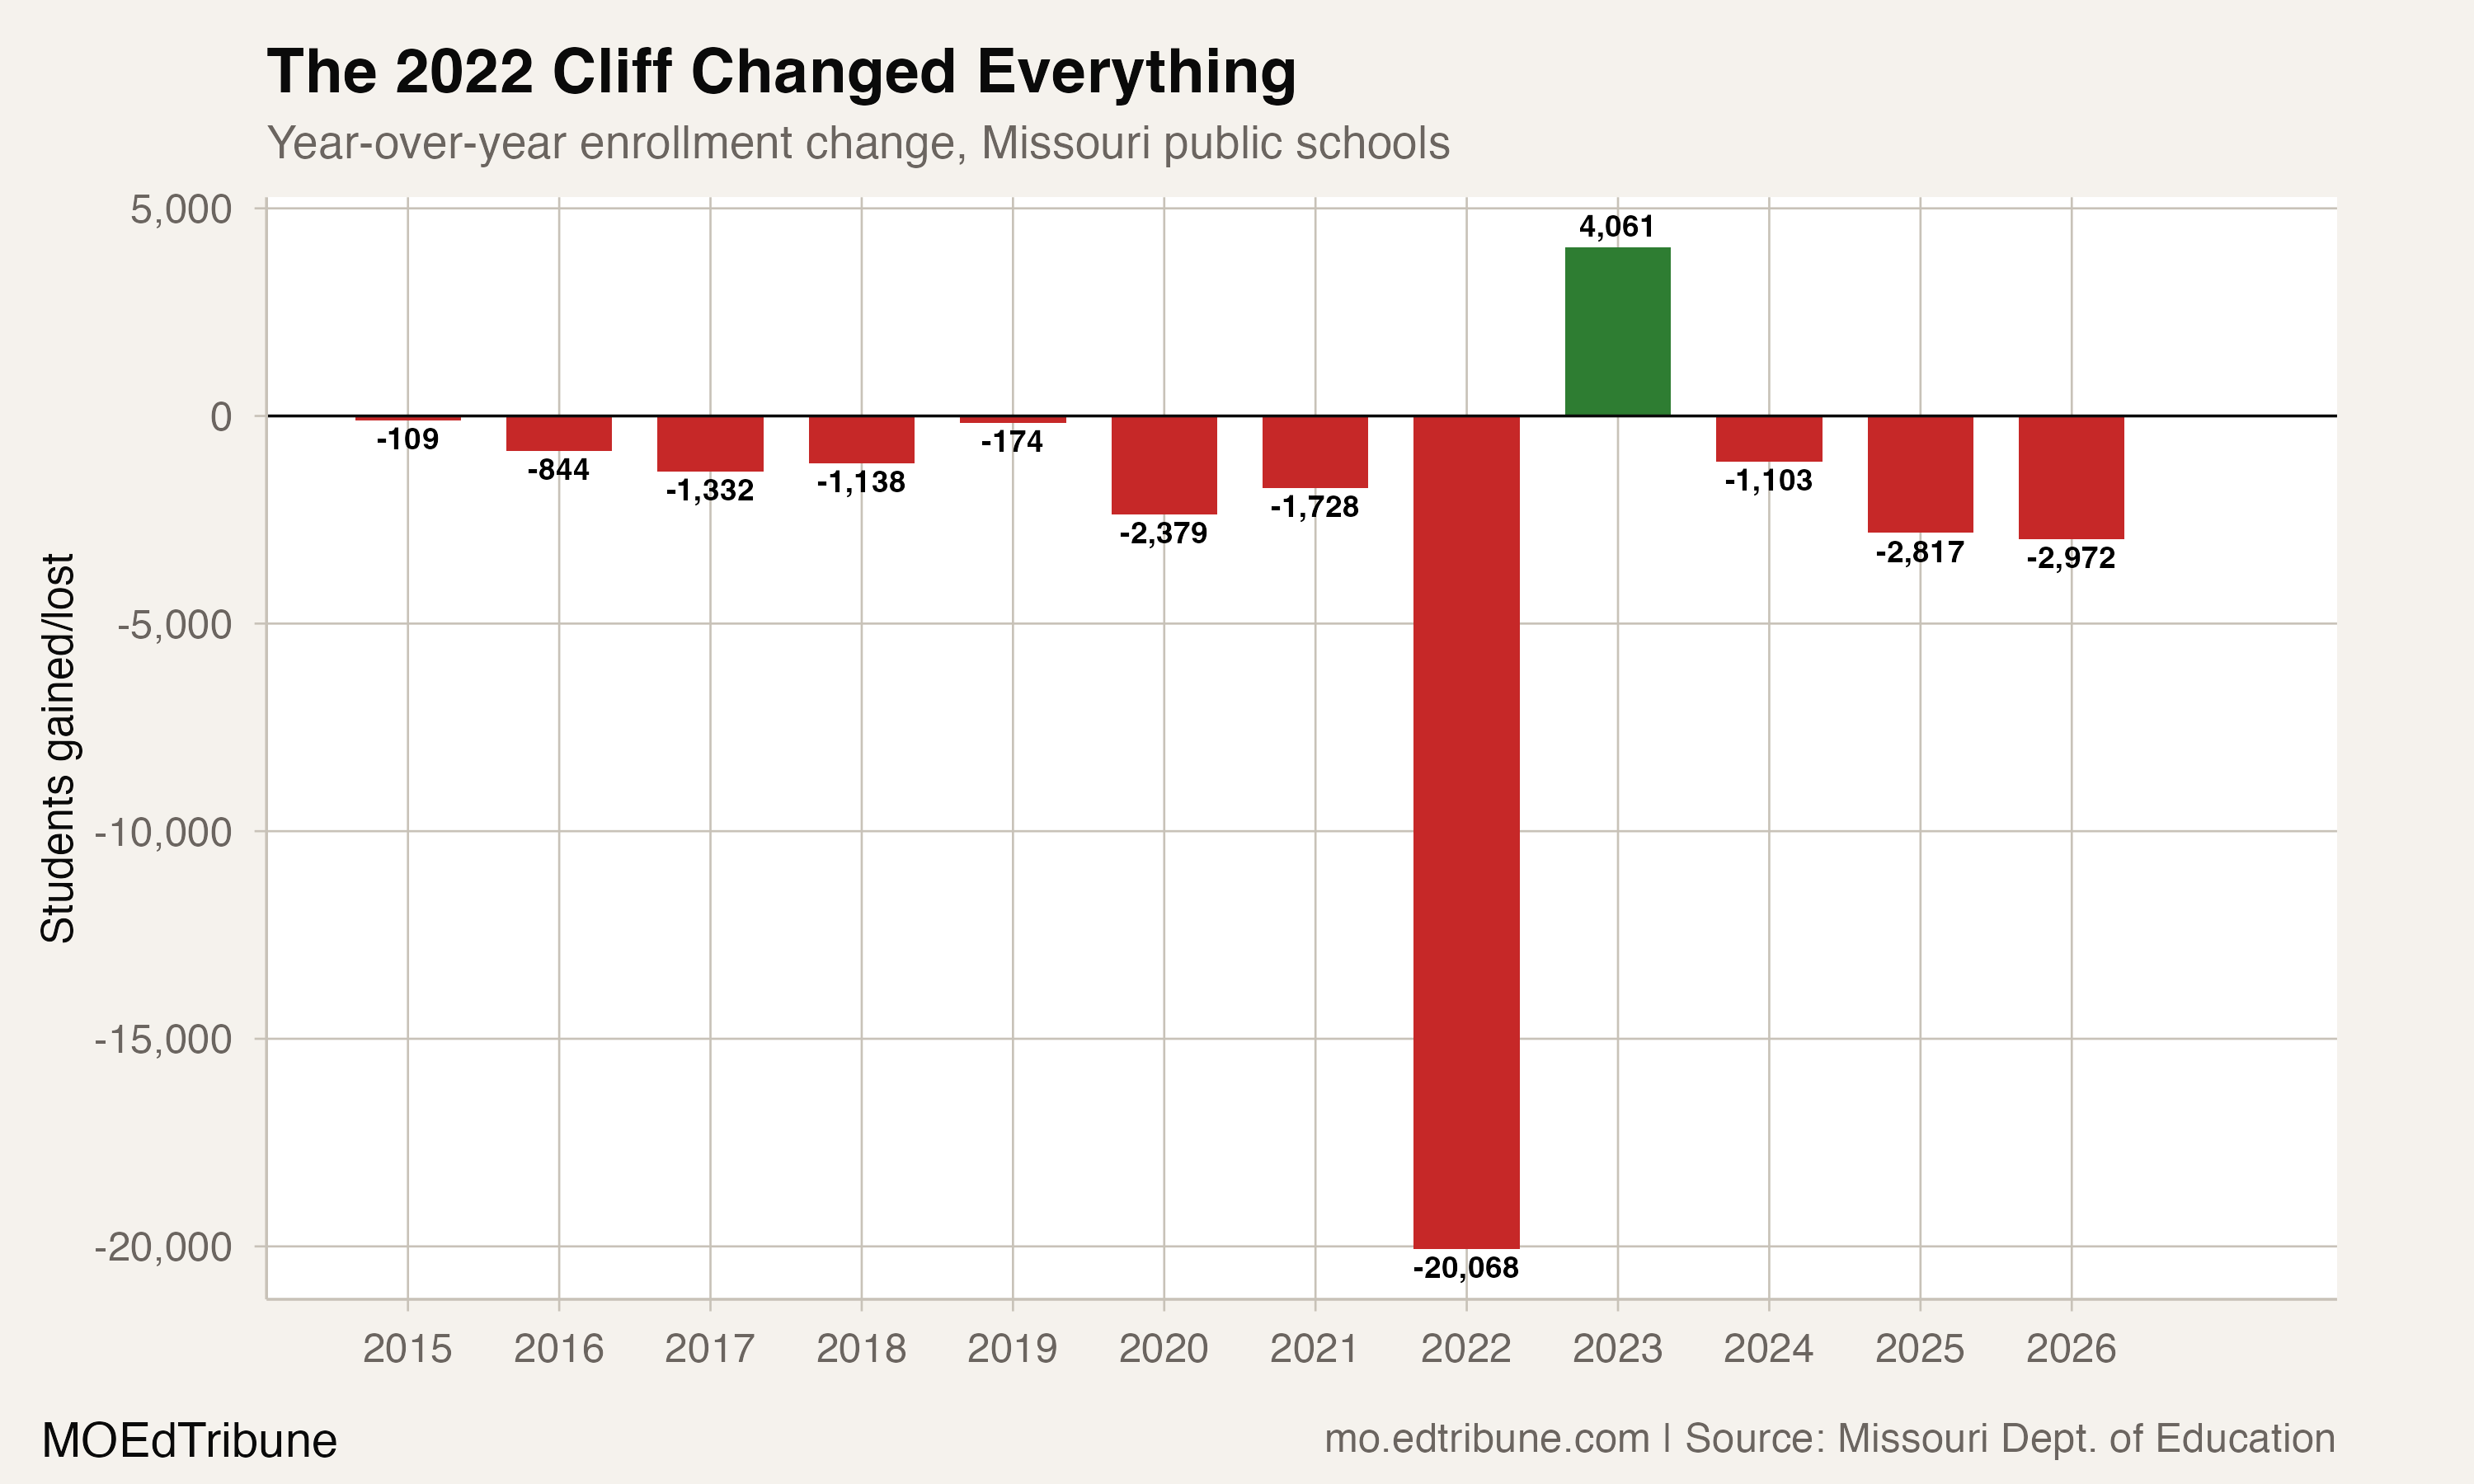
The named district histories in the following chart show different paths relative to their own baseline. The annual files do not identify how much of a change arose from births, migration, school choice, registration or altered reporting.
A recovery share that fell after a rebound
Within the fixed 550-record panel, the share at or above baseline was 50.0% in 2019-20, 32.2% in 2020-21, 38.0% in 2021-22 and 38.5% in 2022-23. It then fell to 33.6% in 2023-24, 31.5% in 2024-25 and 28.9% in preliminary 2025-26.
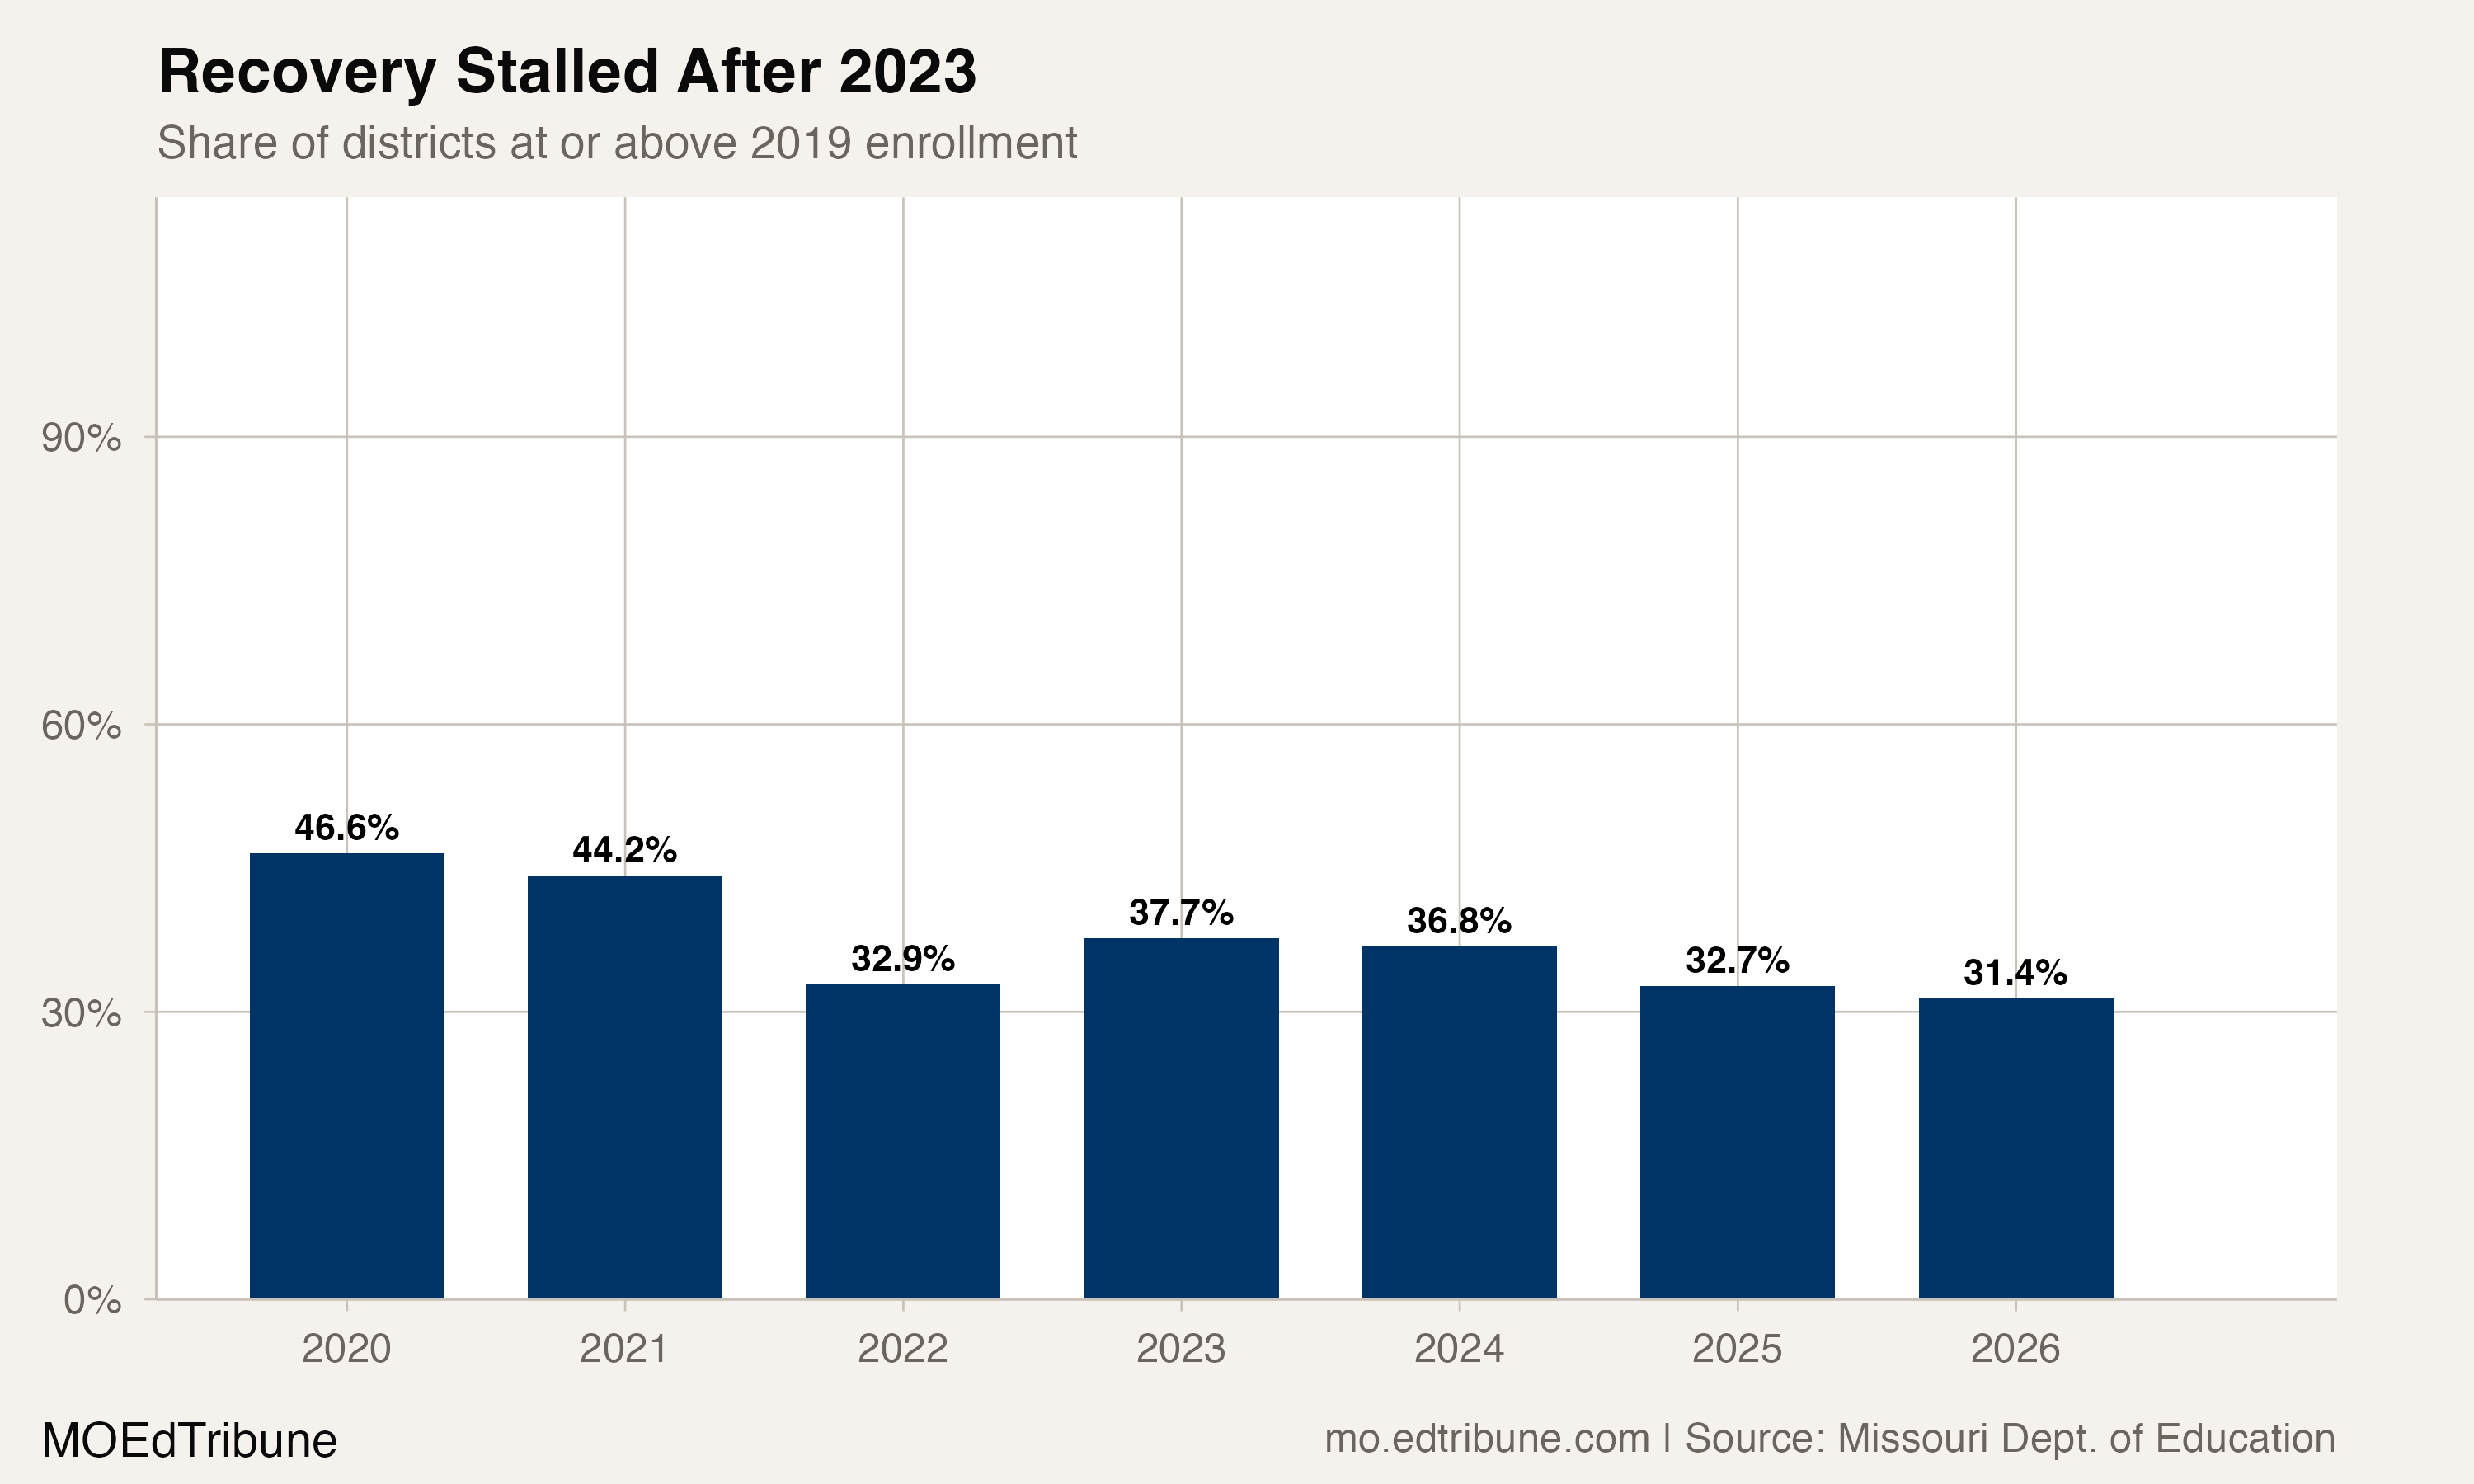
The share fell in each of the final three comparisons. This measures how many reported district totals reached their earlier level, rather than whether the same students returned or which policies worked.
Larger districts recovered less often
Size groups use each district’s published baseline total. The recovery share was 30.6% for records under 500 students, 31.2% for those from 500 through 1,999, and 22.6% for those from 2,000 through 9,999. Among 19 records starting with at least 10,000 students, two reached baseline, or 10.5%.
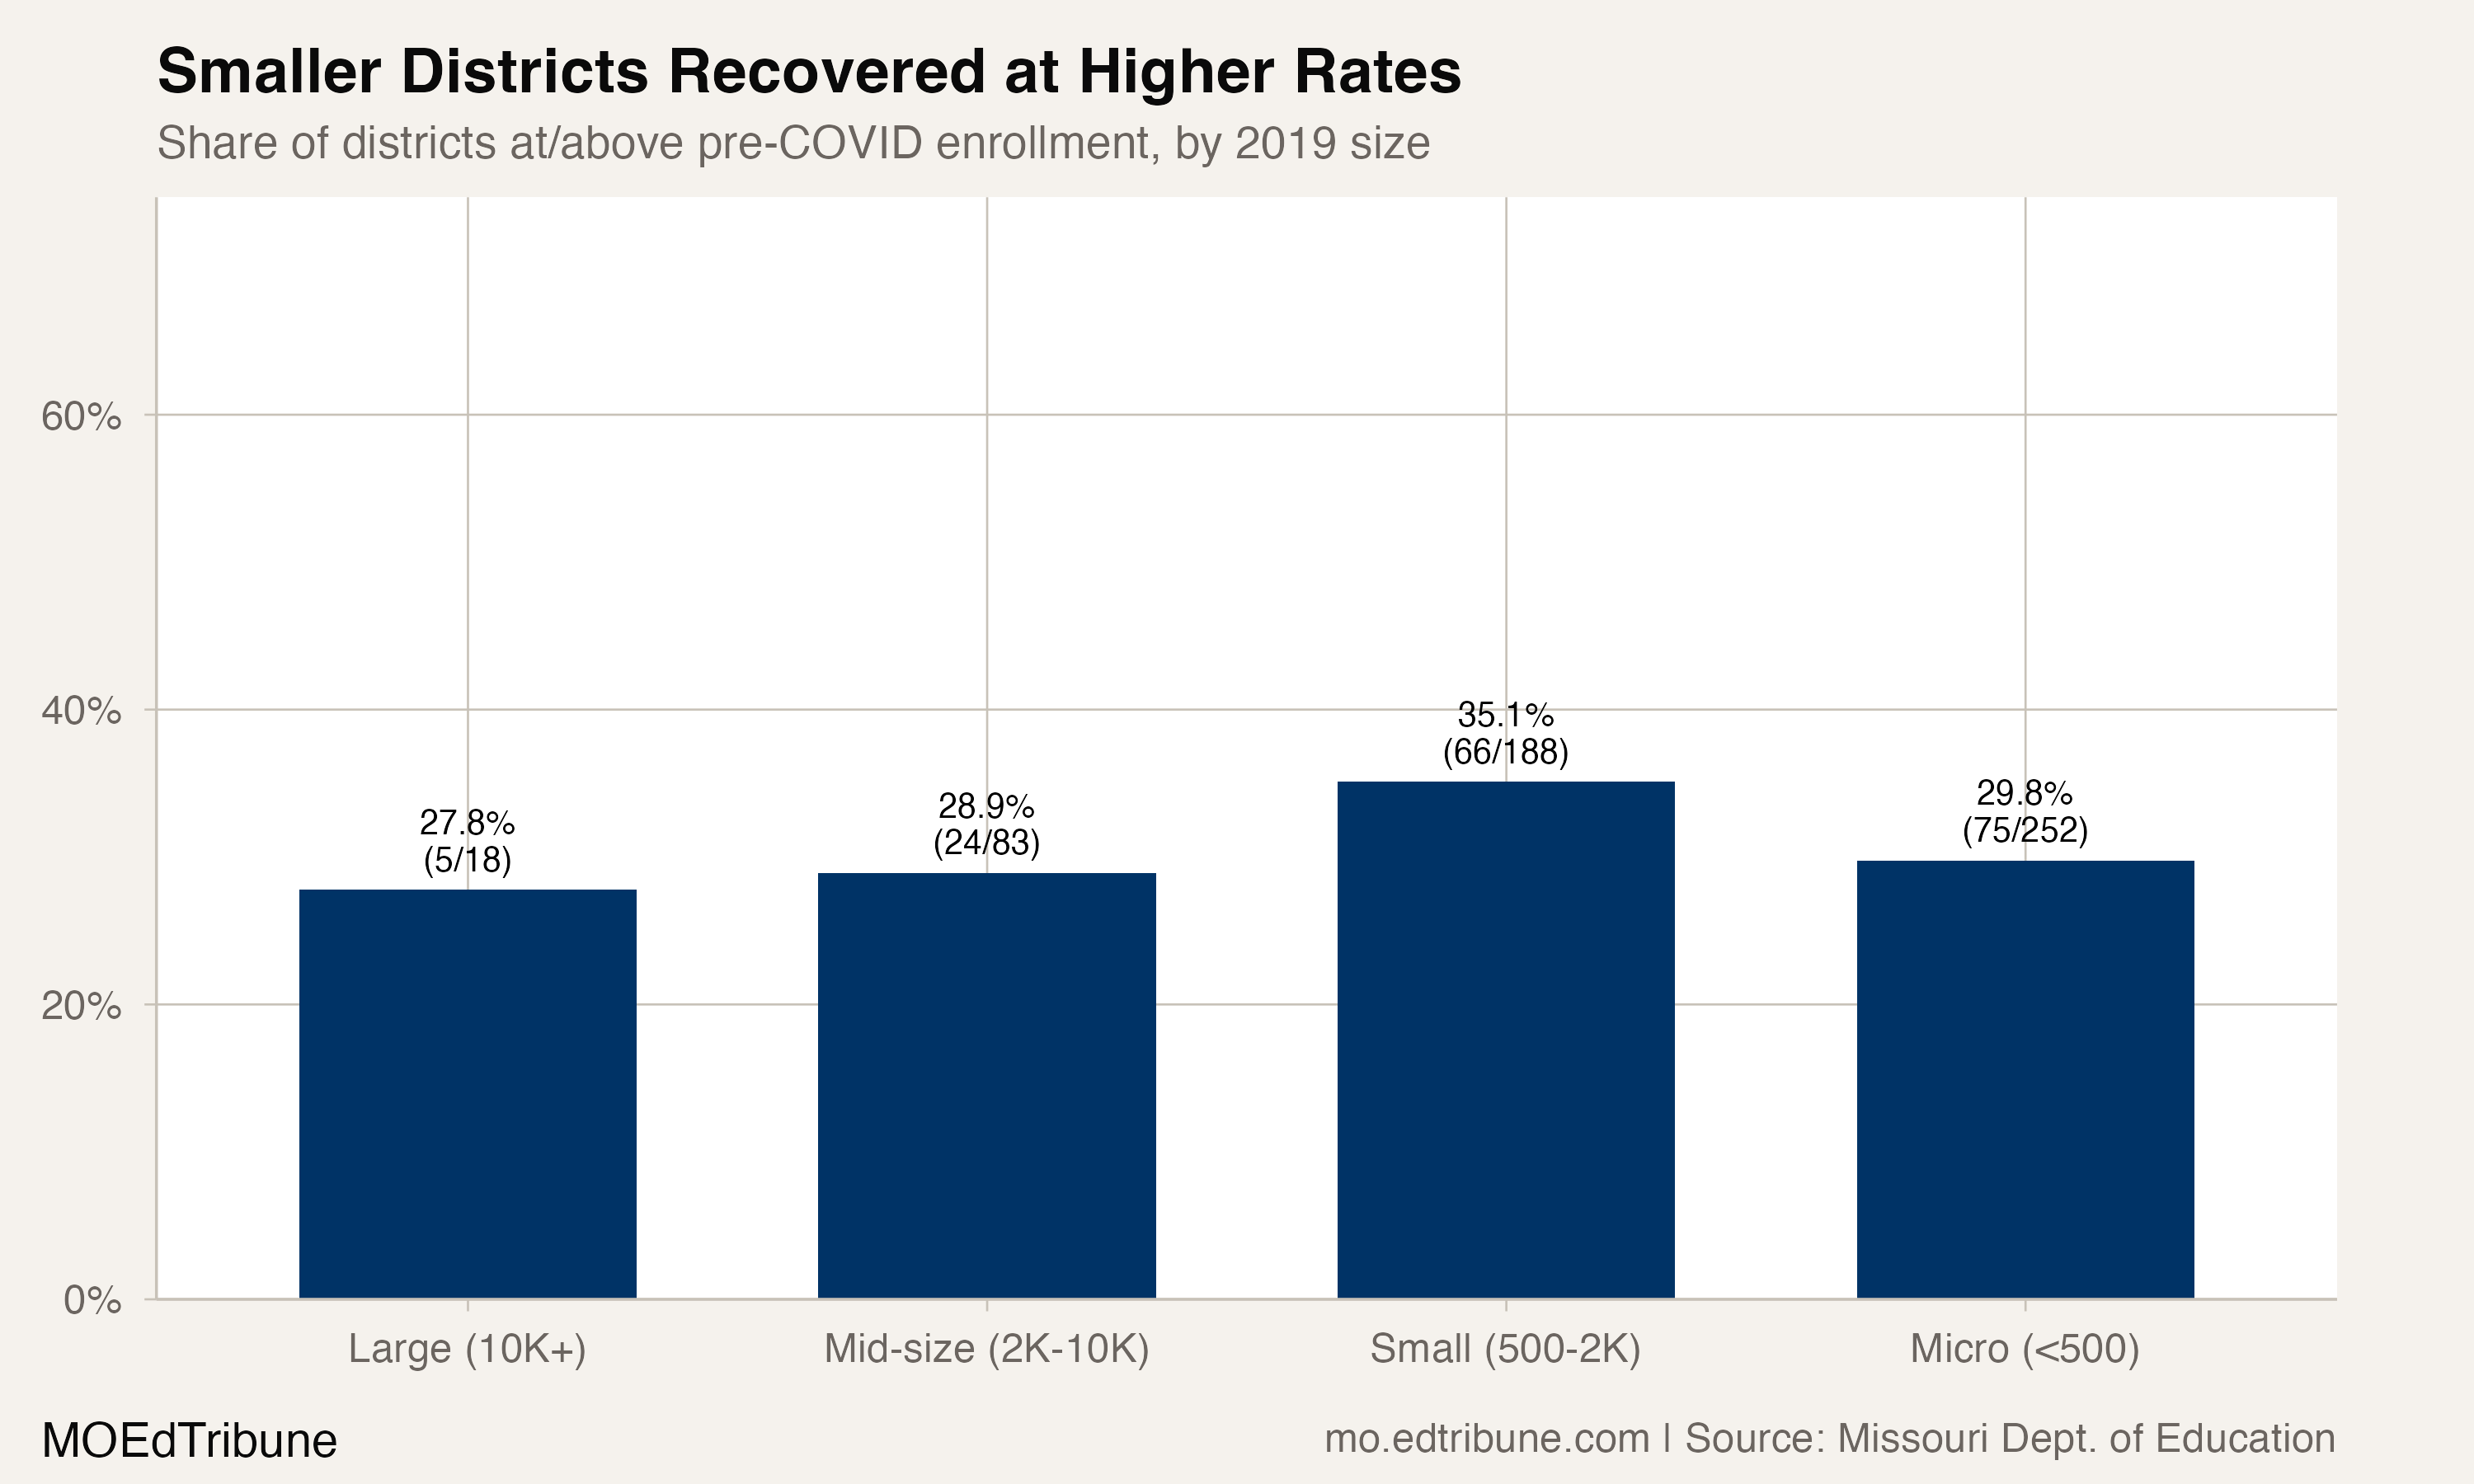
The two large recovered districts were North Kansas City↗ET, up 658 students, and Wentzville↗ET, up 586. Blue Springs↗ET was 74 below baseline, Columbia↗ET was 124 below and Park Hill↗ET was 147 below.
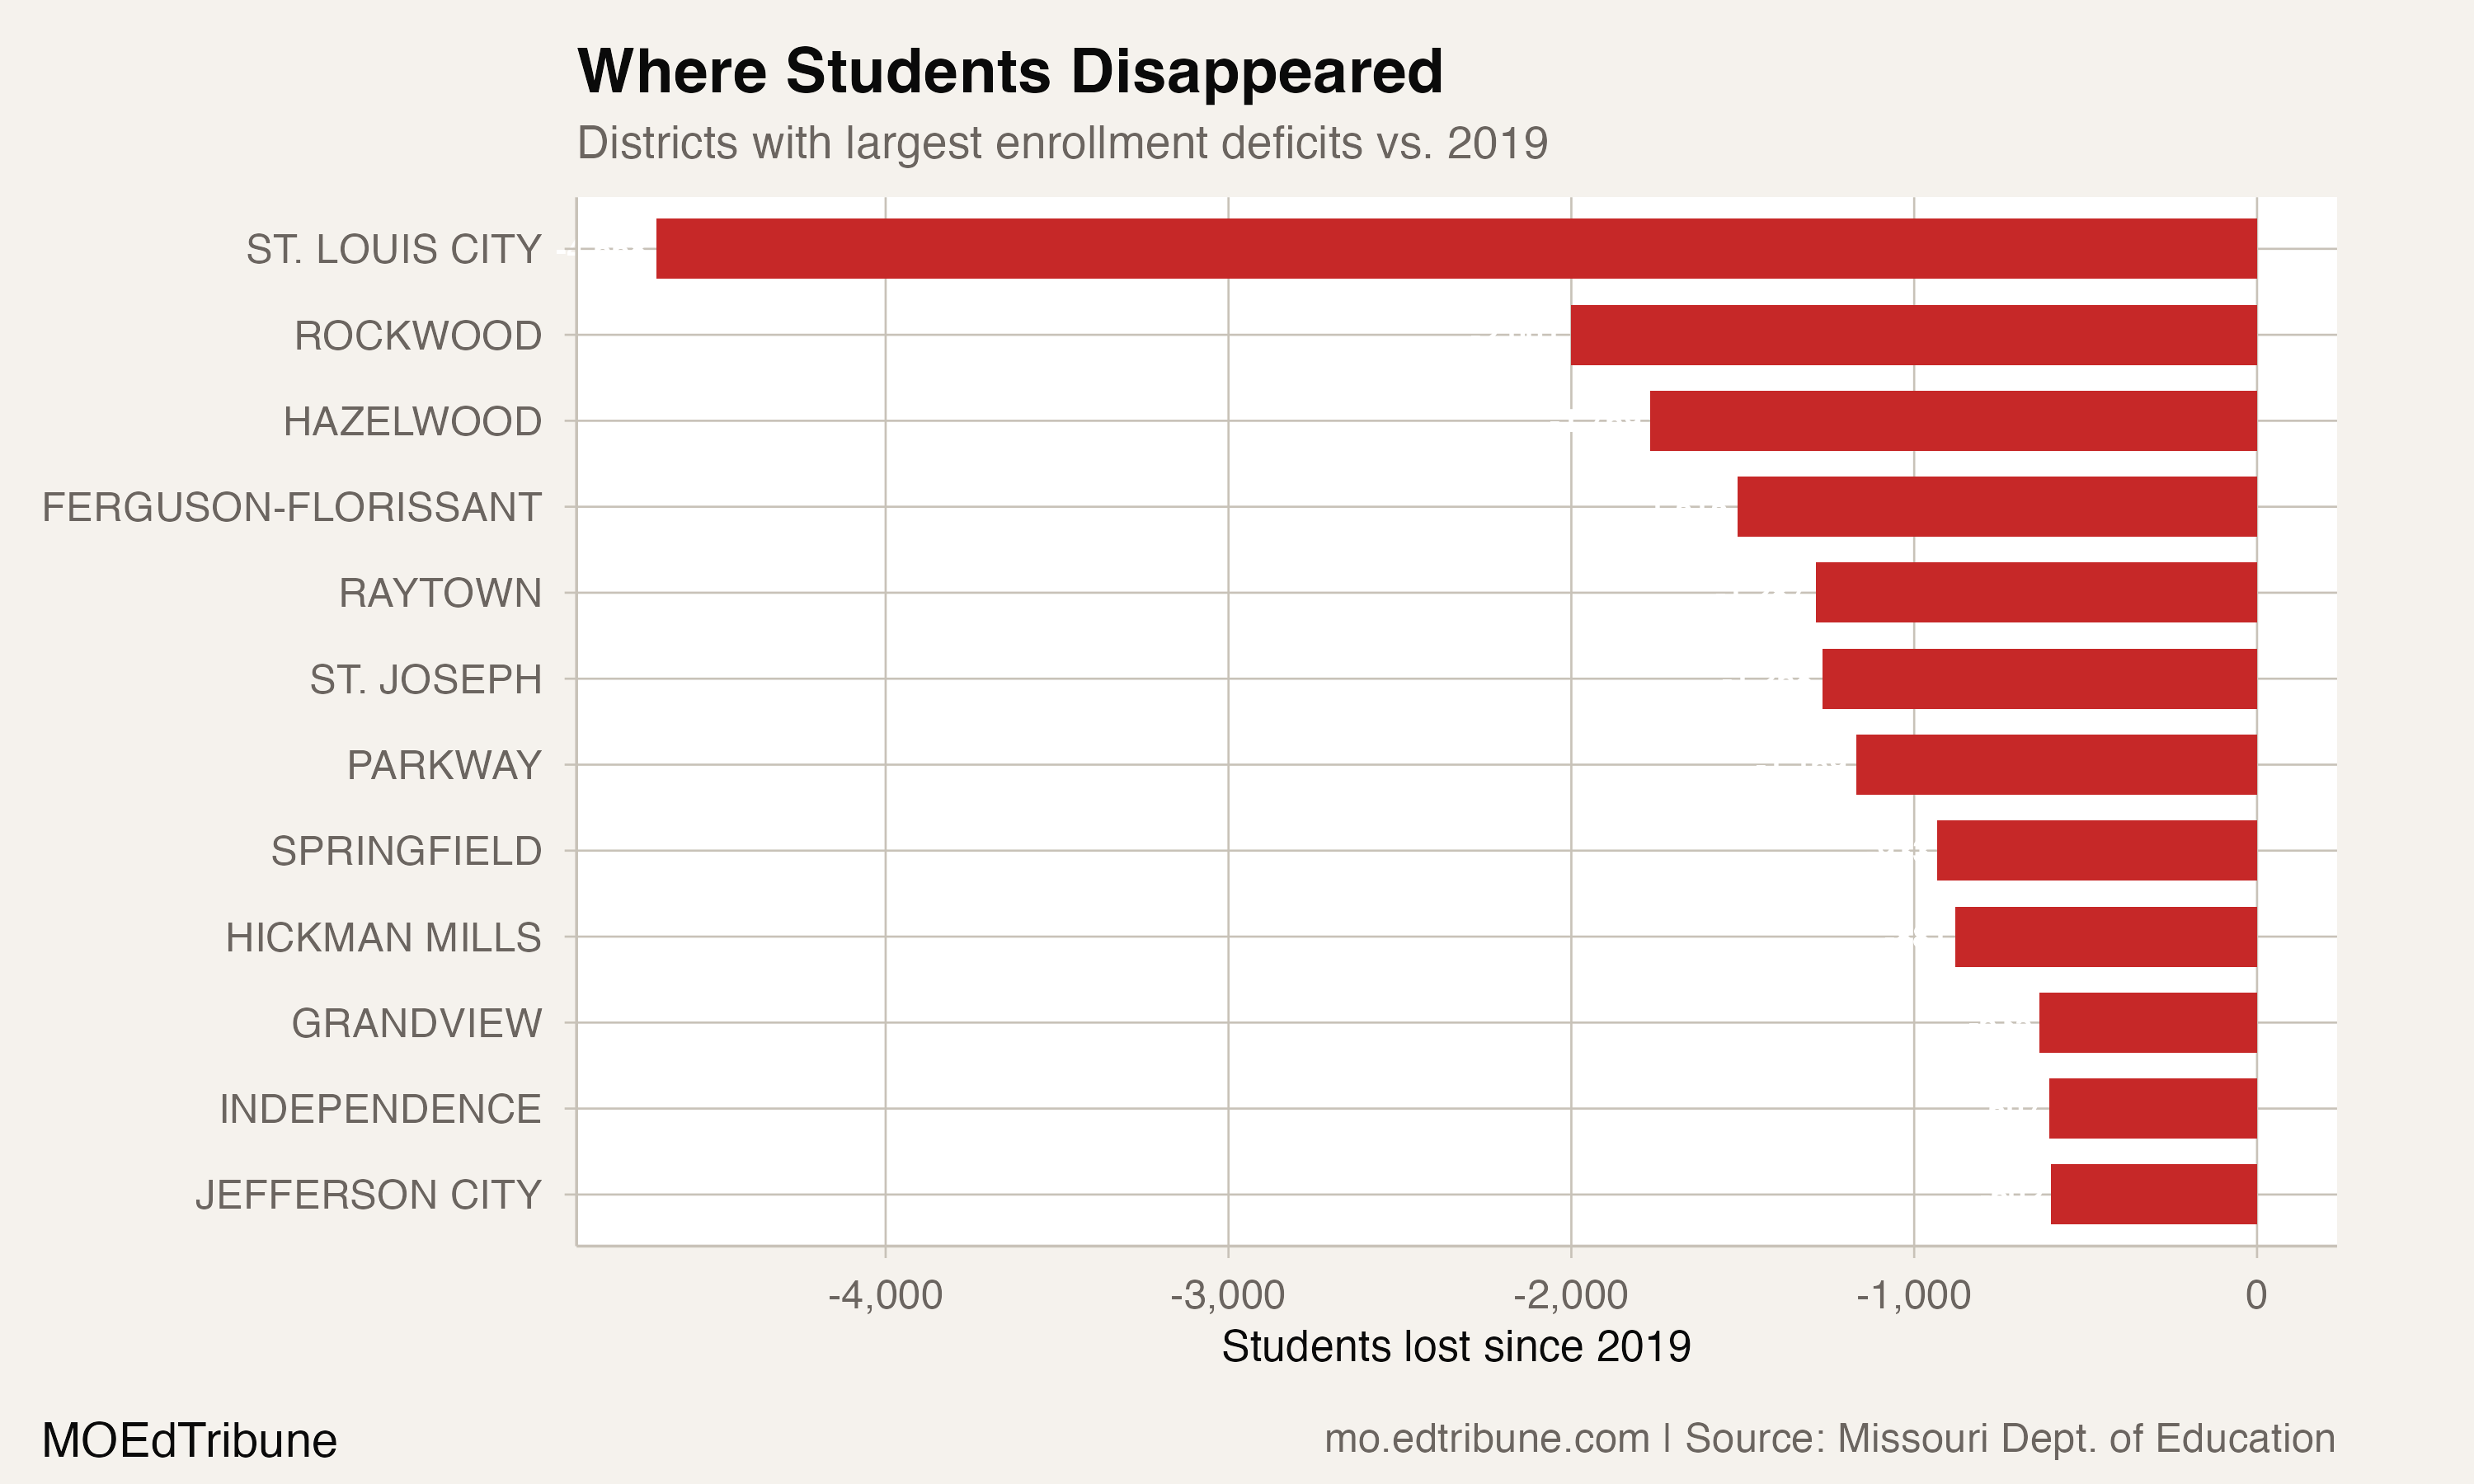
St. Louis City↗ET had the largest deficit in this matched panel: 4,213 students, leaving 15,558, a 21.3% decline. Rockwood’s deficit was 2,302. Springfield↗ET was down 1,412 to 23,512.
Sensitivity and persistence
Three reported district totals grew especially strongly: Grandview R-II↗ET gained 4,492 students, Sturgeon R-V↗ET gained 2,661 and Laquey R-V↗ET gained 2,699. Excluding those named records leaves 156 recovered among 547, or 28.5%. This is a declared sensitivity comparison; it does not estimate why those records grew or remove every possible reporting change.
Within the complete fixed panel, 25 records declined in every annual transition after baseline. A name change does not break an otherwise continuous native-identifier record. The median below-baseline record had lost 52 students, or 10.0% of its own baseline count.
The supported finding is persistent below-baseline enrollment across many comparable reported records, with different outcomes among named districts. It does not certify the withdrawn statewide totals, historical statewide minimum or a pandemic cause for every decline.
Figures come from the Missouri Department of Elementary and Secondary Education’s district and building enrollment files. K12 totals exclude preschool. The 2025-26 figures are preliminary and are the most recent year in these files. Suppressed cells leave exact compatible statewide totals unknown; no partial sum substitutes for them.
Detailed code that reproduces the analysis and figures in this article is available exclusively to EdTribune subscribers.
Discussion
Sign in to join the discussion.
Loading comments...