Correction (October 8, 2026): The district figures below have been independently reconciled to authenticated state enrollment files. The earlier series correction remains part of the article’s history. We have withdrawn statewide enrollment shares, unsupported demographic and funding explanations, and claims that the annual counts prove particular policies caused the changes. The Hollins and Brooks quotations now use exact wording from the cited report. Historical extrema refer only to the stated observation window.
Normandy Schools Collaborative↗ET reported 2,387 students in preliminary 2025-26, last school year and the most recent year in these files. That was 202 below the preceding year and the lowest published count in its complete 2000-01 through 2025-26 record.
At the beginning of that window, the district reported 5,603 students. The endpoint loss was 3,216, or 57.4%. Of the 25 annual comparisons between the endpoints, 17 were declines. There were gains along the way, but the longest run of consecutive annual gains lasted two years.
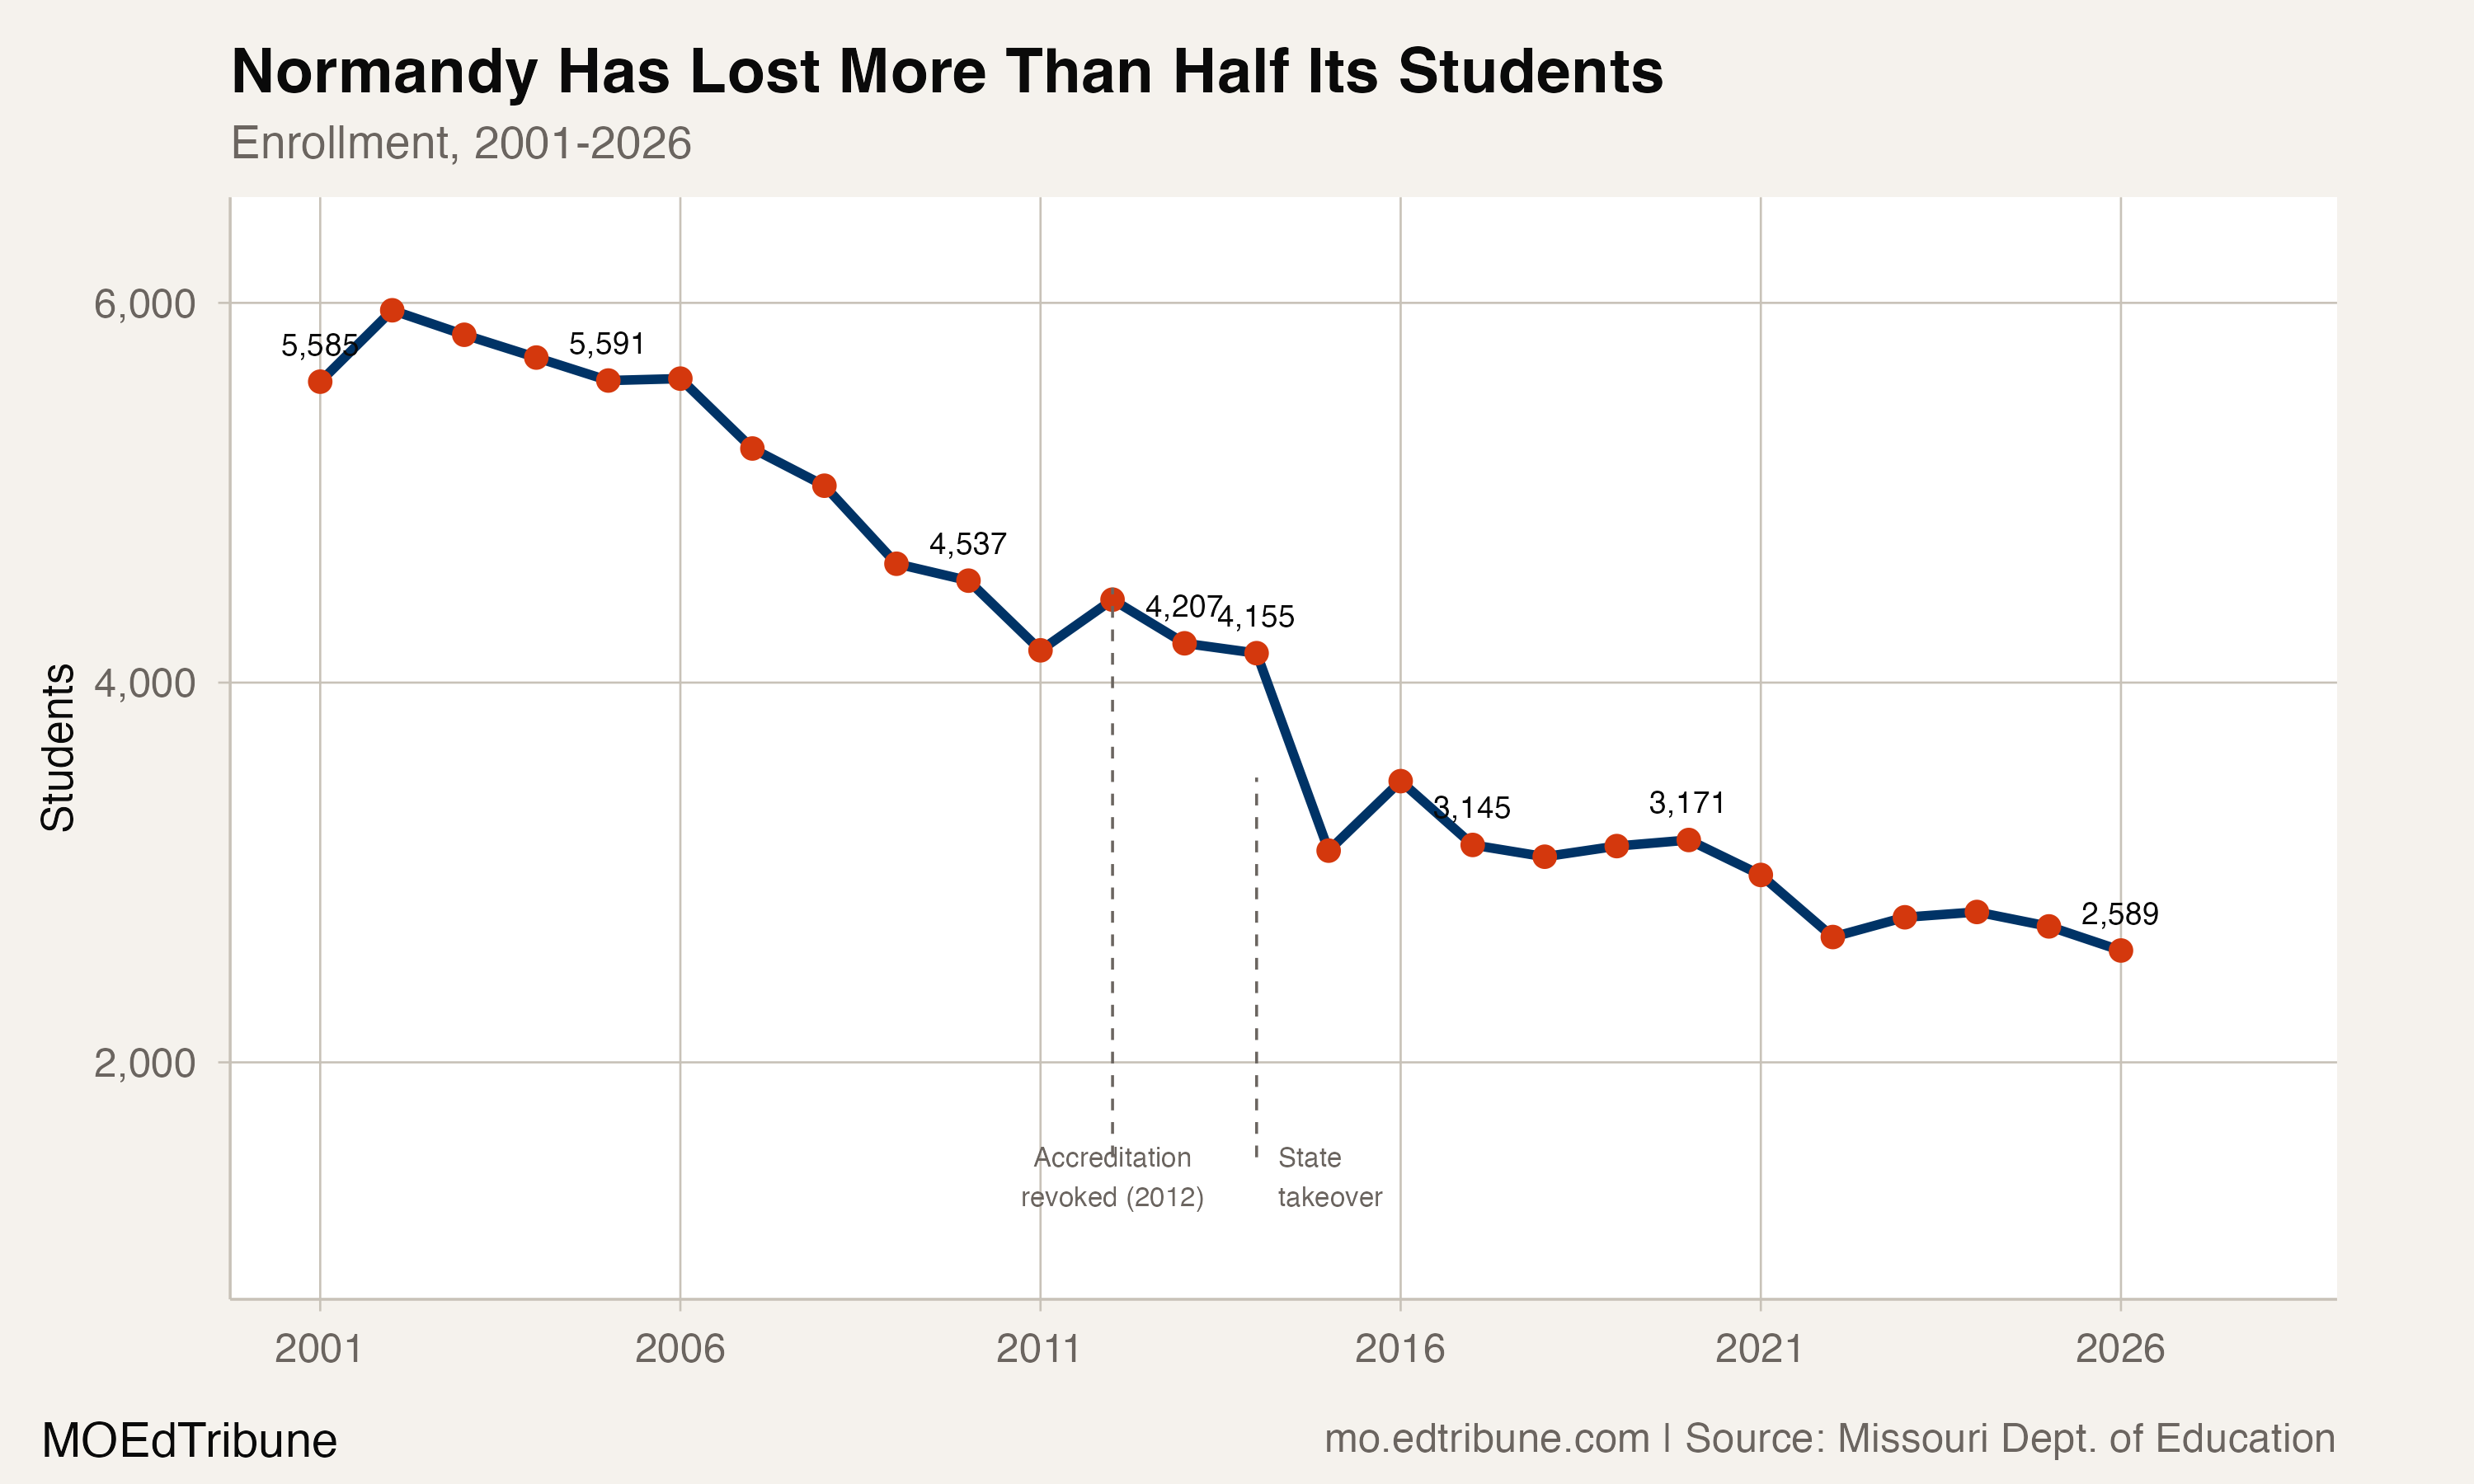
These are published kindergarten-through-12th-grade totals, excluding preschool, under the state’s native district identifier. The name changes within the files, and the state announced that a new agency would replace the former district within its footprint. The shared identifier permits a reported count history; it does not make this an unchanged legal entity or a fixed-population study of every child living in the area.
The largest decline and the largest rebound
The first period, 2000-01 through 2012-13, ended with a loss of 1,450 students, or 25.9%. Nine of its twelve annual comparisons were declines, including a loss of 411 in 2007-08. Decline therefore preceded the sharpest annual drop in the observation window.
The state classified Normandy as unaccredited following a board decision in September 2012. Its published count then fell from 4,153 in 2012-13 to 2,936 in 2013-14: a loss of 1,217, or 29.3%. That is the largest annual loss in this observed count history.
The state’s reconstitution announcement established the Collaborative effective July 2014. The following count, for 2014-15, gained 545 students, or 18.6%, the largest annual increase in the observed window. The district then lost 336 in 2015-16.
Educator John Wright described the intervention to ProPublica: "In order to save the district, they killed the district."
Those dates and that quotation provide historical context. The enrollment series does not identify which students transferred or how much of any annual change arose from transfers, births, migration, registration or classification. A change following a policy is not, by itself, a measurement of the policy’s effect.
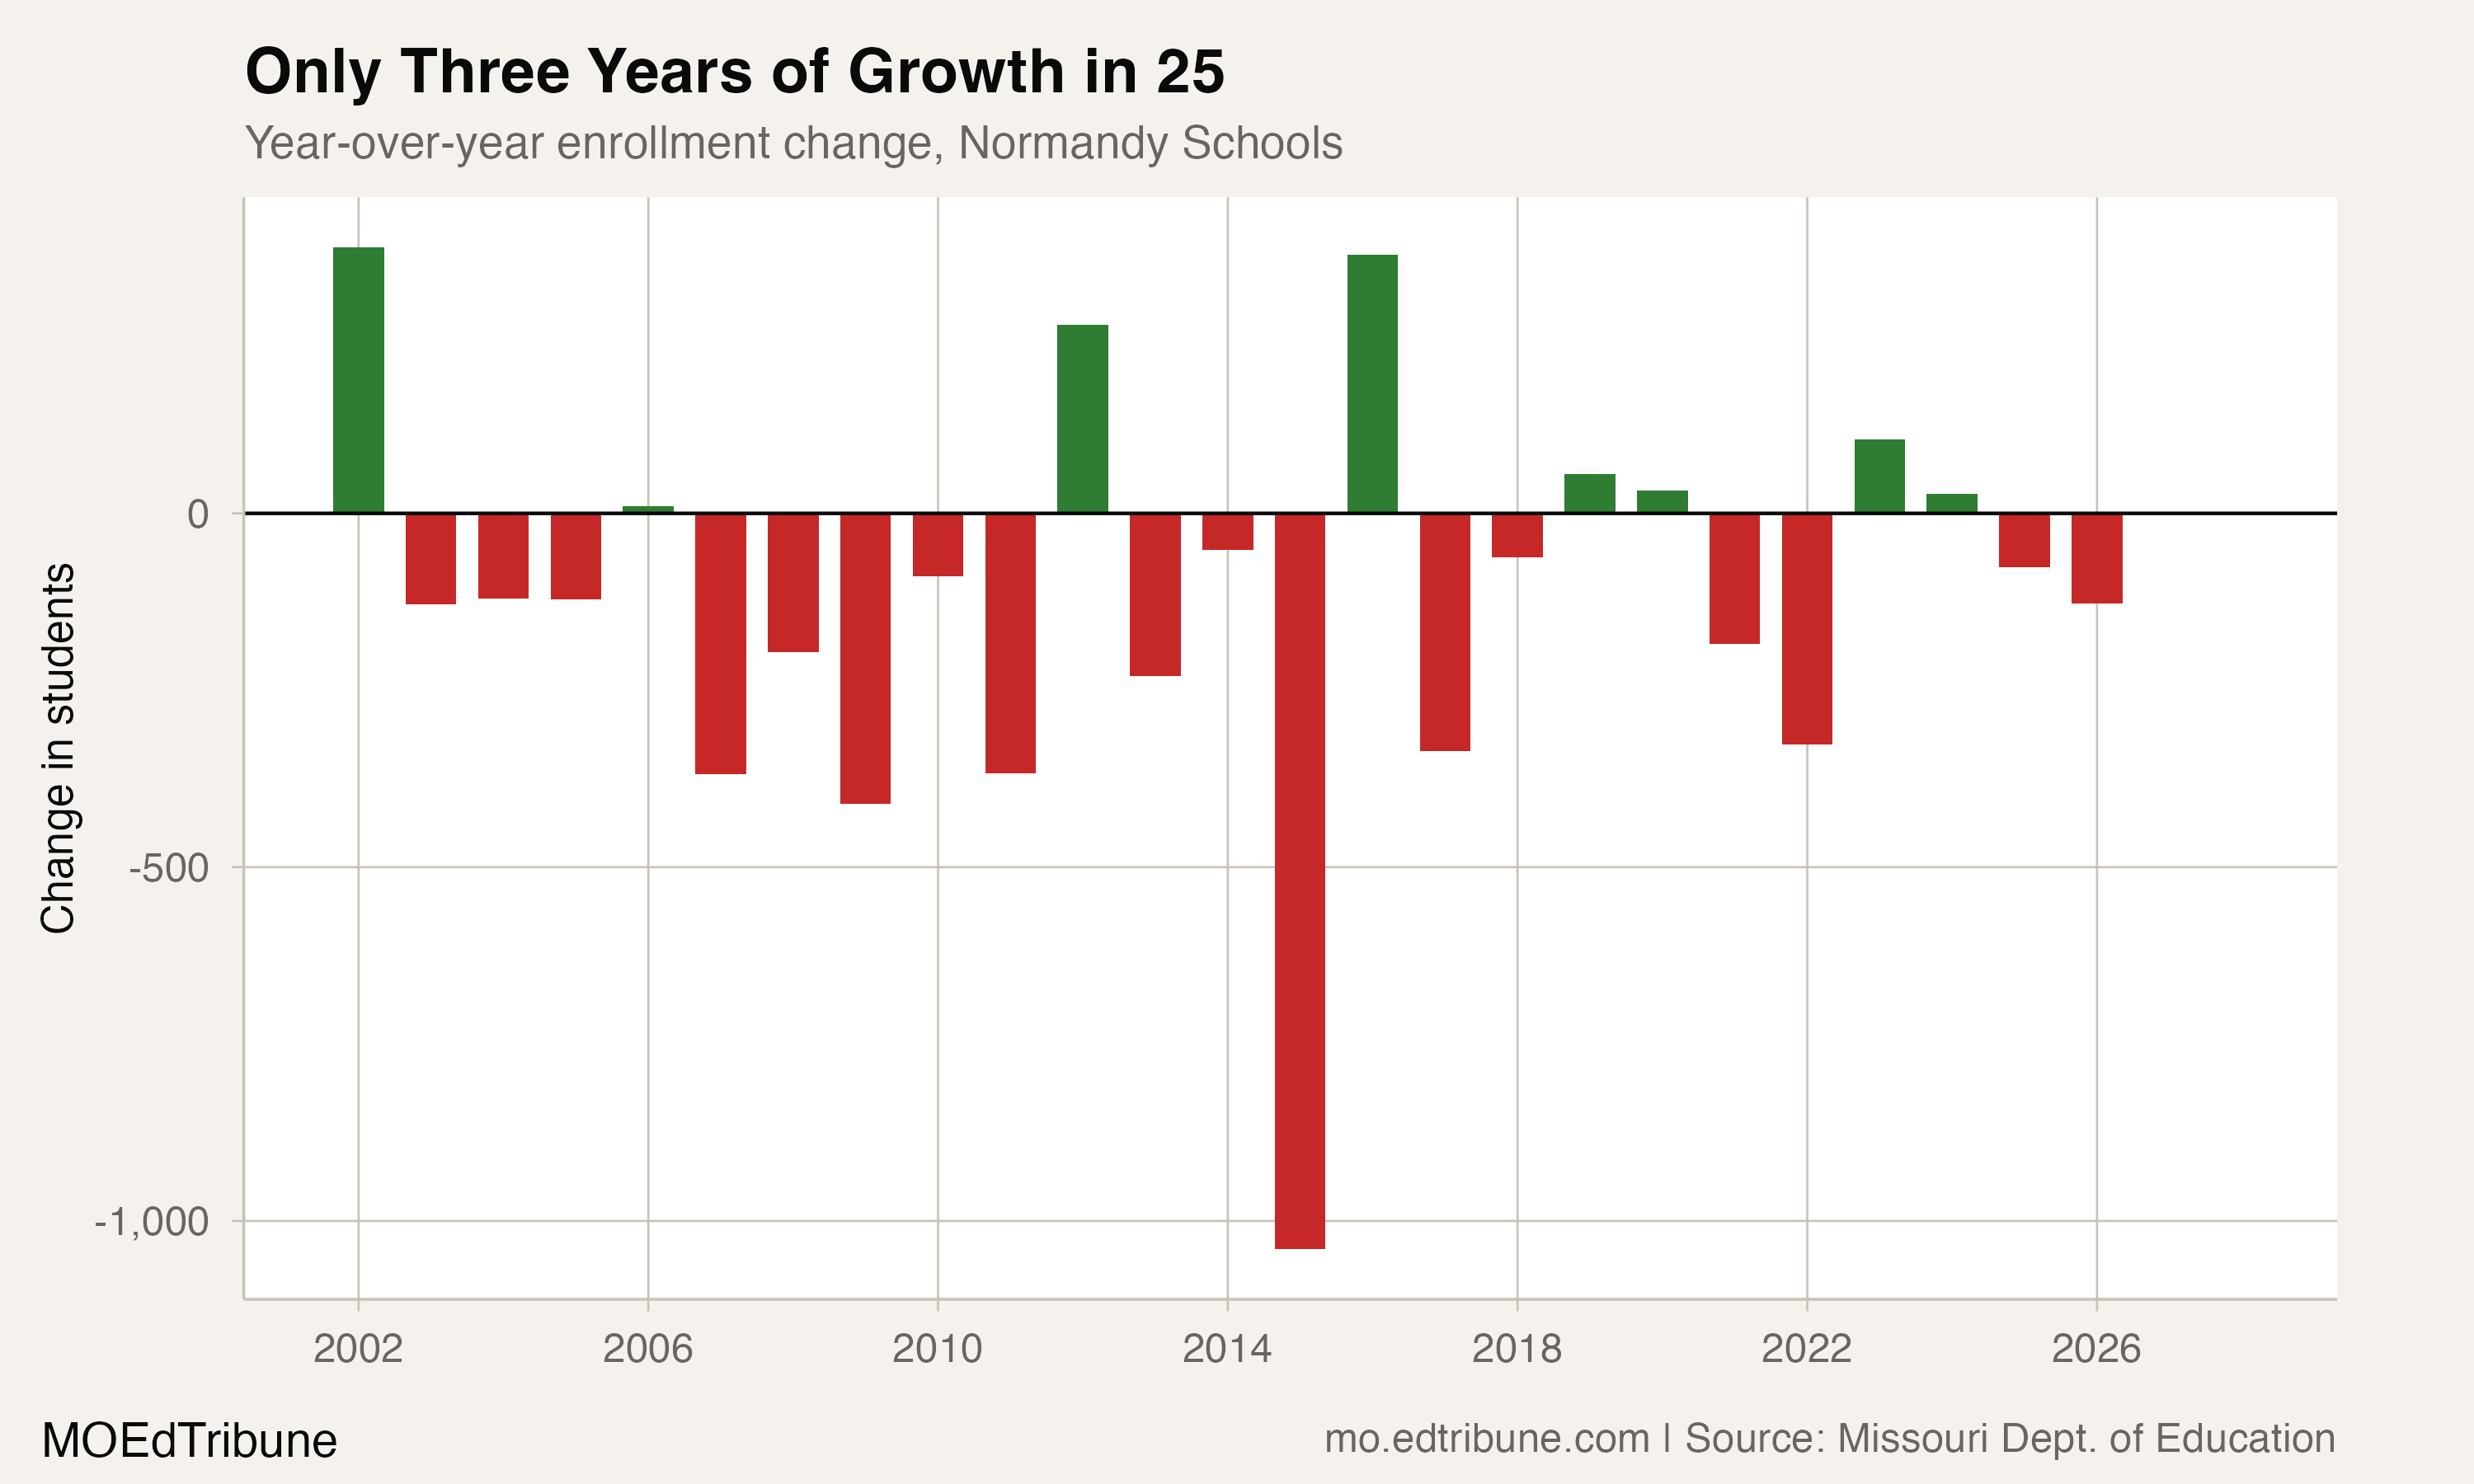
By 2017-18, Normandy’s published count was 3,139, or 1,014 below its lowest count in the part of the window ending in 2012-13. The earlier rebound had not returned the reported count to that earlier range. That comparison does not establish whether particular families stayed or left.
Different amounts of decline among named peers
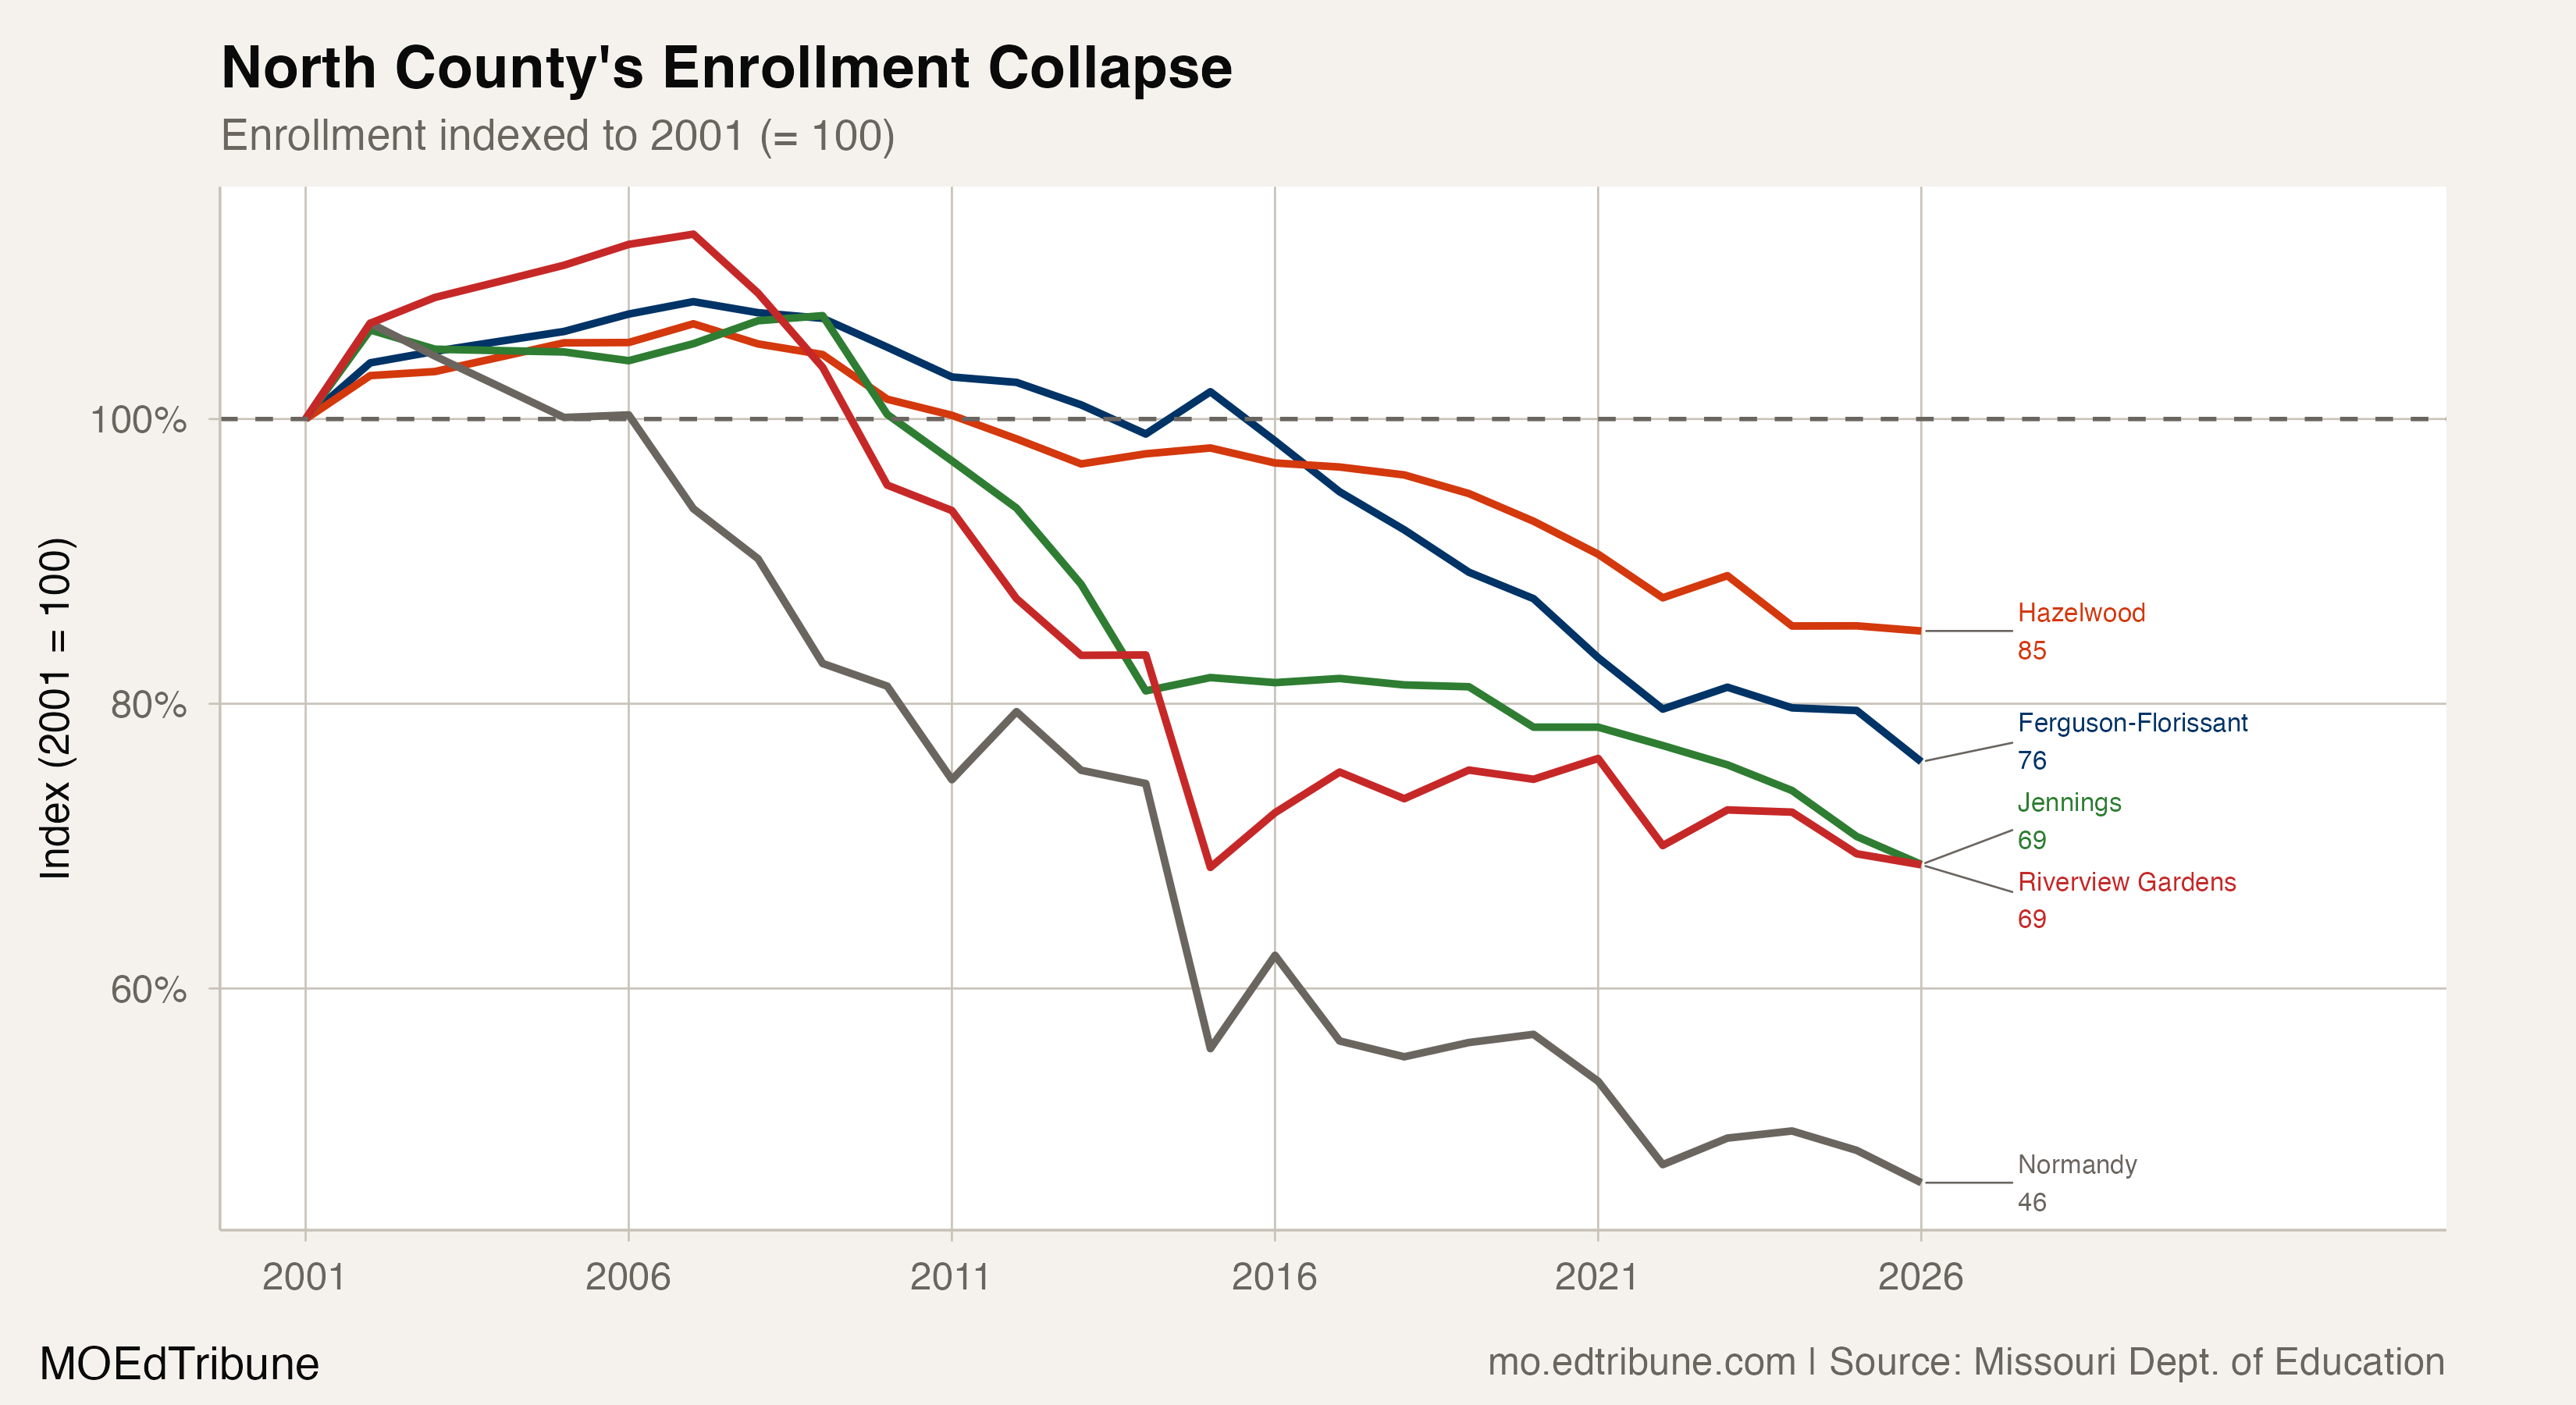
The five named district histories in the peer chart are complete across the same observation window. Every one ended below its starting count. Riverview Gardens↗ET fell 34.6%, Jennings↗ET 34.0%, Ferguson-Florissant↗ET 27.8% and Hazelwood↗ET 17.0%.
Normandy’s 57.4% loss was the largest of those five. Indexed to each district’s own starting count, Normandy ended at 43 and Riverview Gardens at 65, rounded. These are five declared examples, not a complete geographic census of north St. Louis County.
St. Louis City↗ET fell 62.9% between the endpoints. Its starting count was 41,988, compared with Normandy’s 5,603. Within the 516 districts with published totals at both endpoints, ten had larger percentage losses than Normandy. Nine of those began below a thousand students; the largest starting count among those nine was 532. St. Louis City was the remaining district. The comparison describes matched reported records, rather than the change in an exact statewide total.
Four periods, all with a net loss
The four periods in the chart partition the endpoint decline. The first lost 1,450 students. The second, 2012-13 through 2015-16, lost 1,008. The third, 2015-16 through 2019-20, lost 158. The fourth, 2019-20 through preliminary 2025-26, lost 600, or 20.1% of its starting count. Their changes add to the whole-window decline.
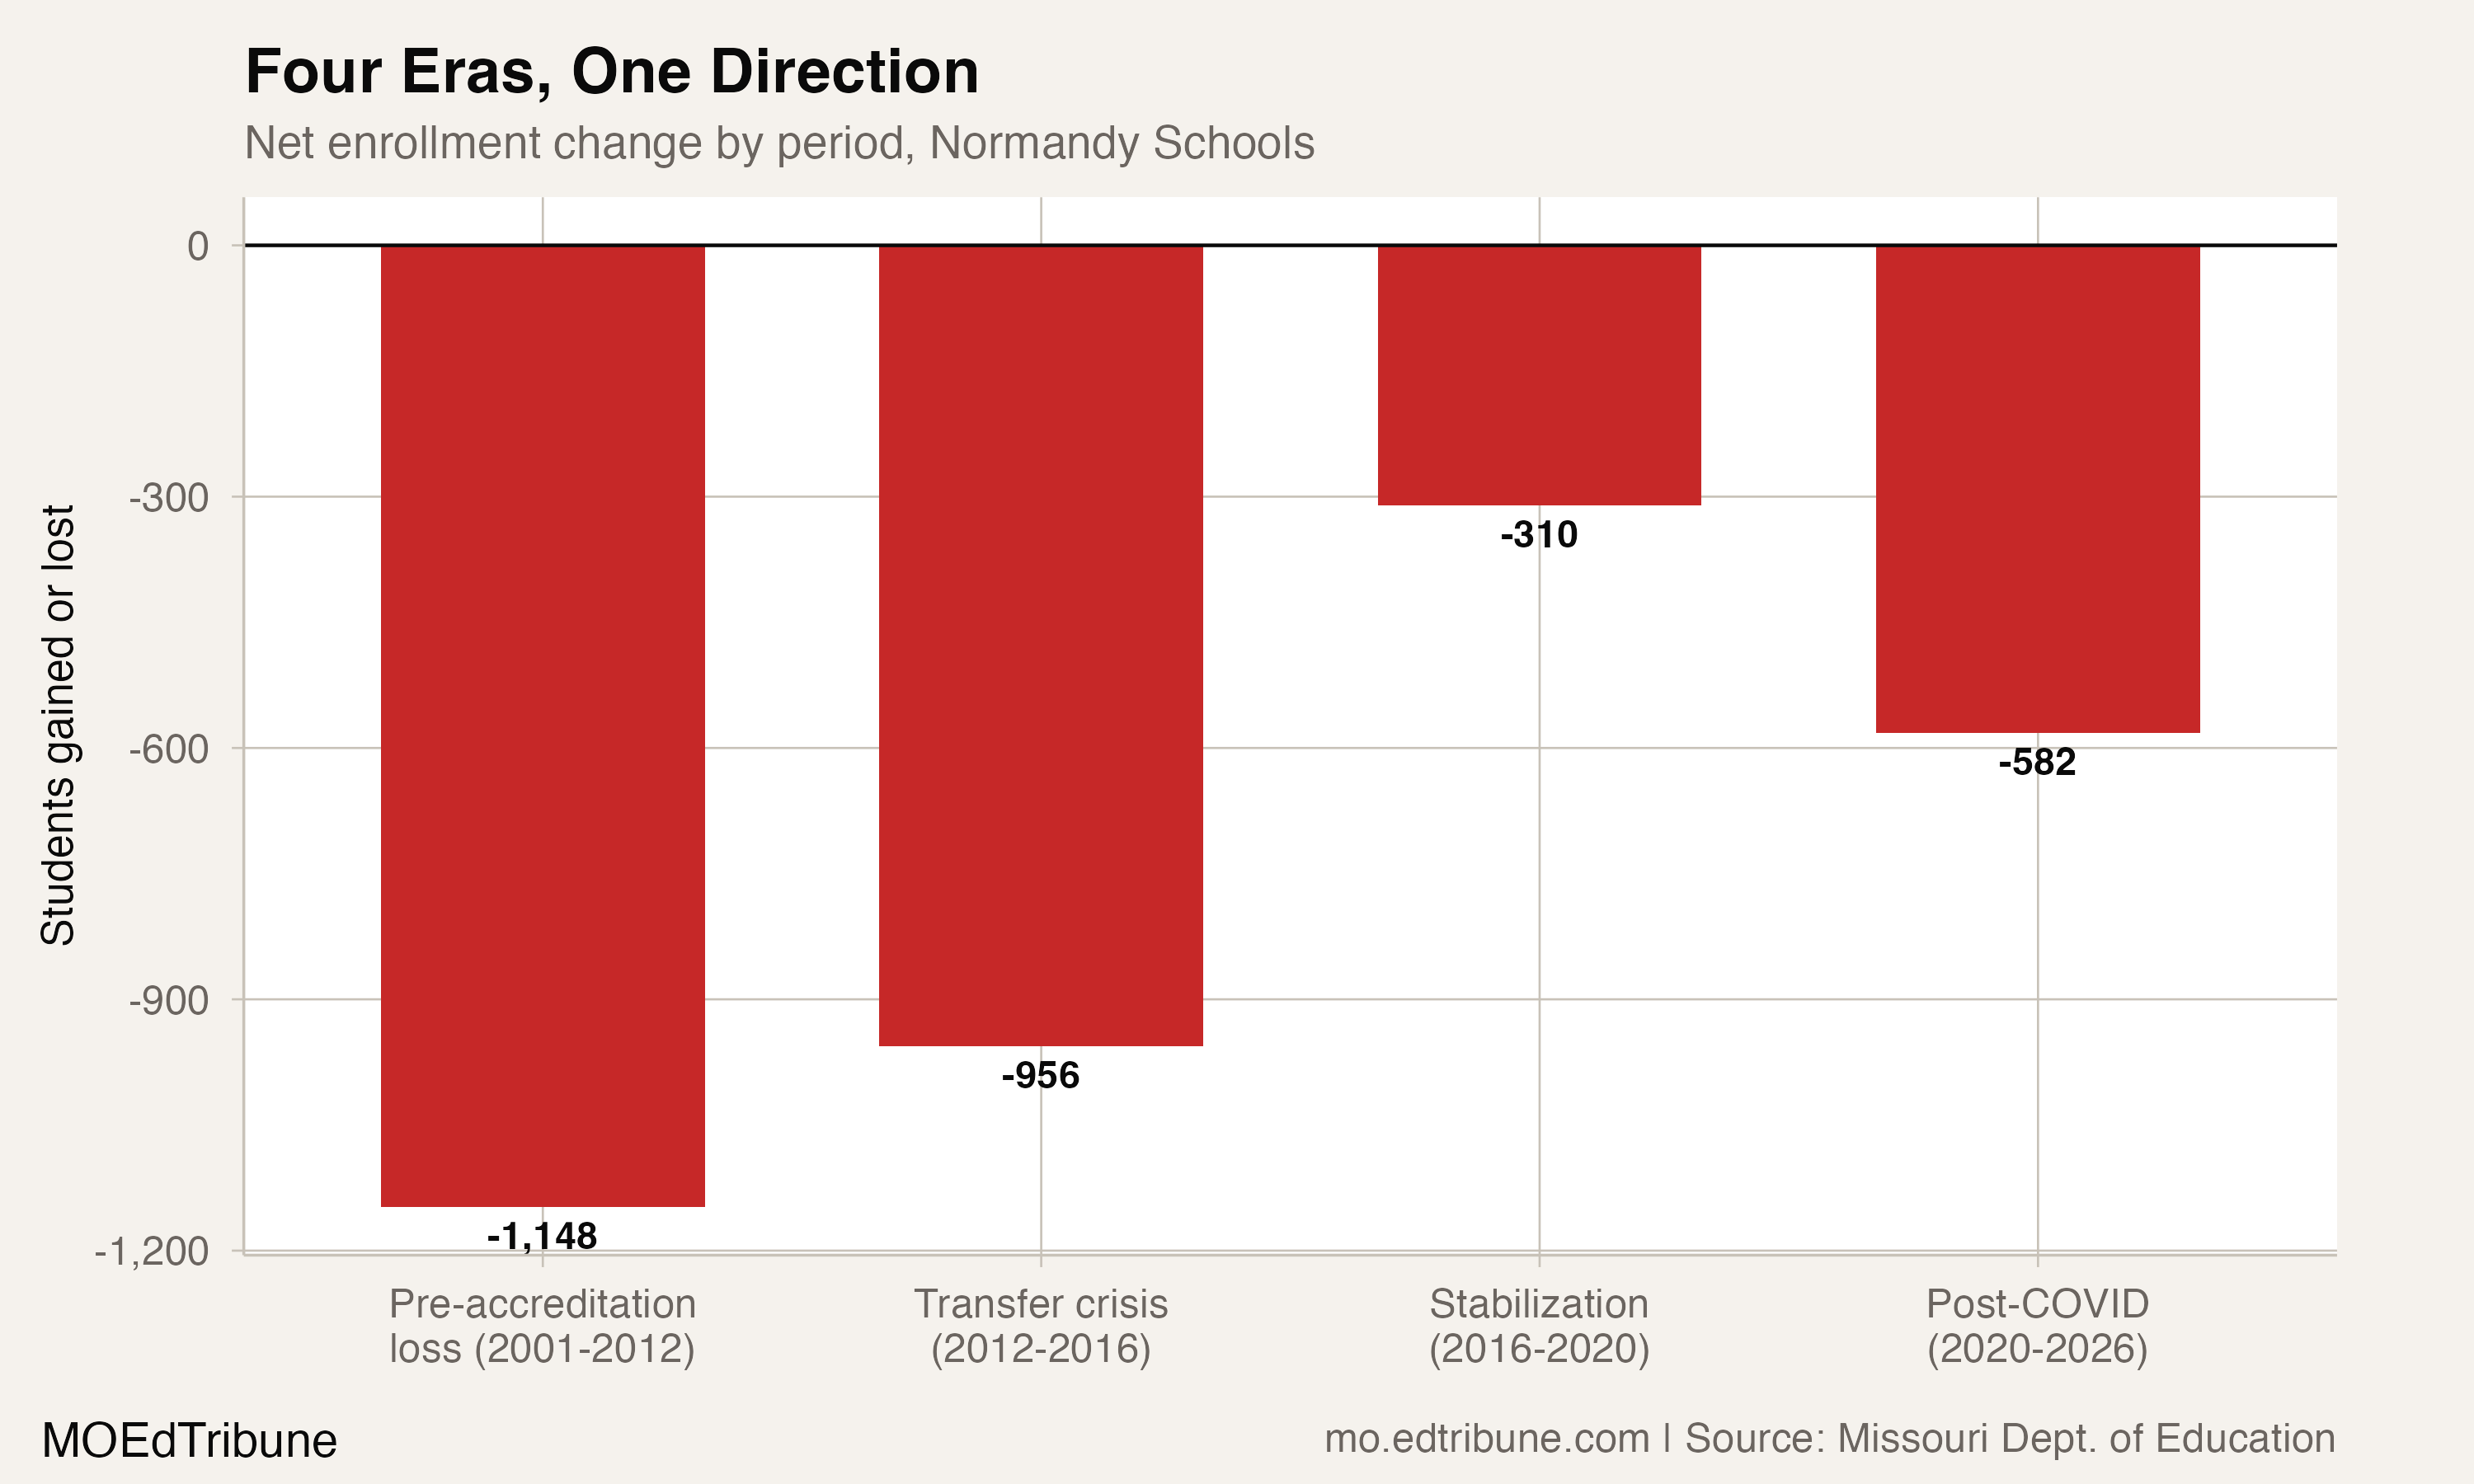
Within the final period, the district lost 327 students in 2020-21, a 10.9% annual decline. That was its second-steepest annual percentage loss in the observed window. Gains of 104 and 28 followed in 2021-22 and 2022-23. Then came losses of 76 in 2023-24, 127 in 2024-25 and 202 in preliminary 2025-26. The recent sequence includes both directions, ending with three annual declines.
What the enrollment campaign showed
The state completed the transition back to local governance in October 2023. In August 2025, St. Louis Public Radio reported that Normandy staff were knocking on doors to encourage registration.
In that report, principal Pamela Hollins said that "numbers dictate how many staff we have, how many students are in classrooms, how many sections of everything". CFO Carlton Brooks said: "So in order to pay our teachers and educate our children successfully, we've got to have good enrollment."
Those attributed statements describe administrators’ concerns and planning. The published enrollment count subsequently fell, but these annual files do not measure the campaign’s effectiveness or calculate state funding lost per student. They establish the district’s smaller reported K12 count and the long decline across this observation window.
Enrollment figures come from the Missouri Department of Elementary and Secondary Education’s district and building enrollment files. Counts for 2025-26 are preliminary. Exact compatible statewide totals and shares are unavailable under suppression; no partial district sum substitutes for them.
Detailed code that reproduces the analysis and figures in this article is available exclusively to EdTribune subscribers.
Discussion
Sign in to join the discussion.
Loading comments...