Correction (October 8, 2026): The named district counts and complete group comparisons below have been reverified on authenticated enrollment files. “Inner” and “outer” are this article’s fixed lists, not a census of geographic rings. We have withdrawn the inference that these totals demonstrate families moving between districts, prove particular demographic or fiscal causes, or forecast the region’s future. Minima and maxima refer to the stated observation window. The Sandoval and Dillon quotations remain as attributed context. We have withdrawn a previously included Curtis Cain quotation because its original publisher source could not be independently reverified.
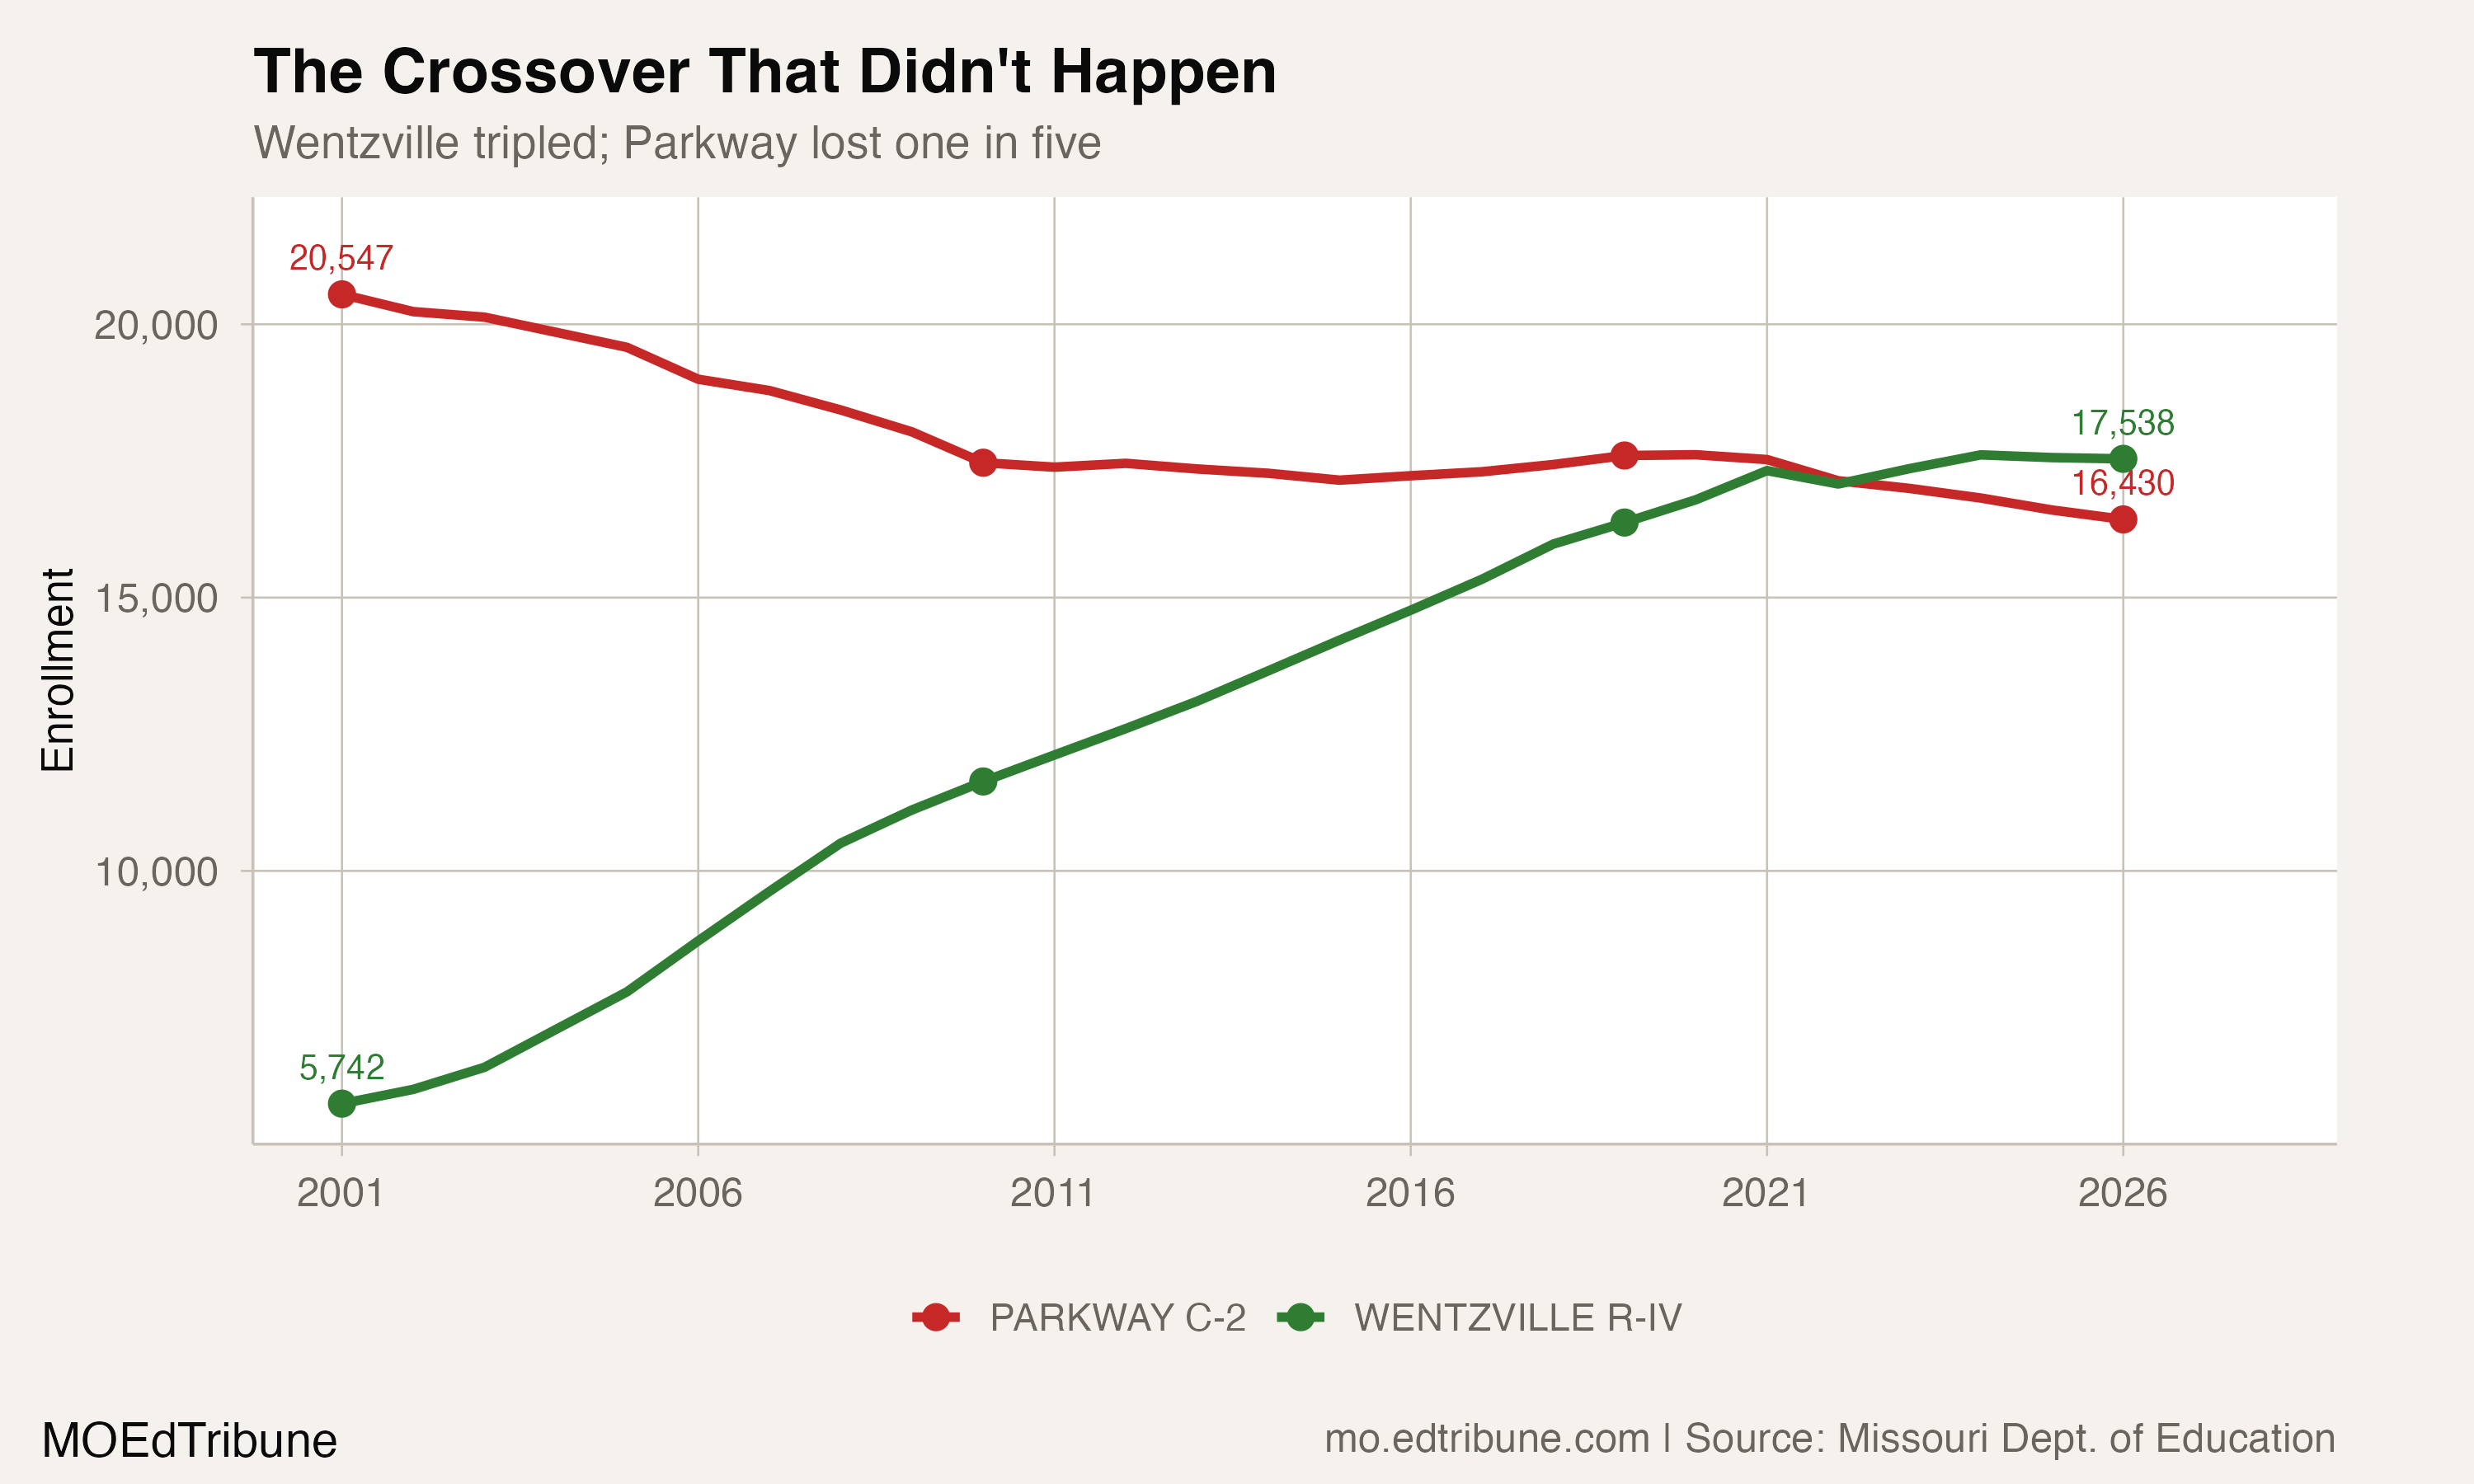
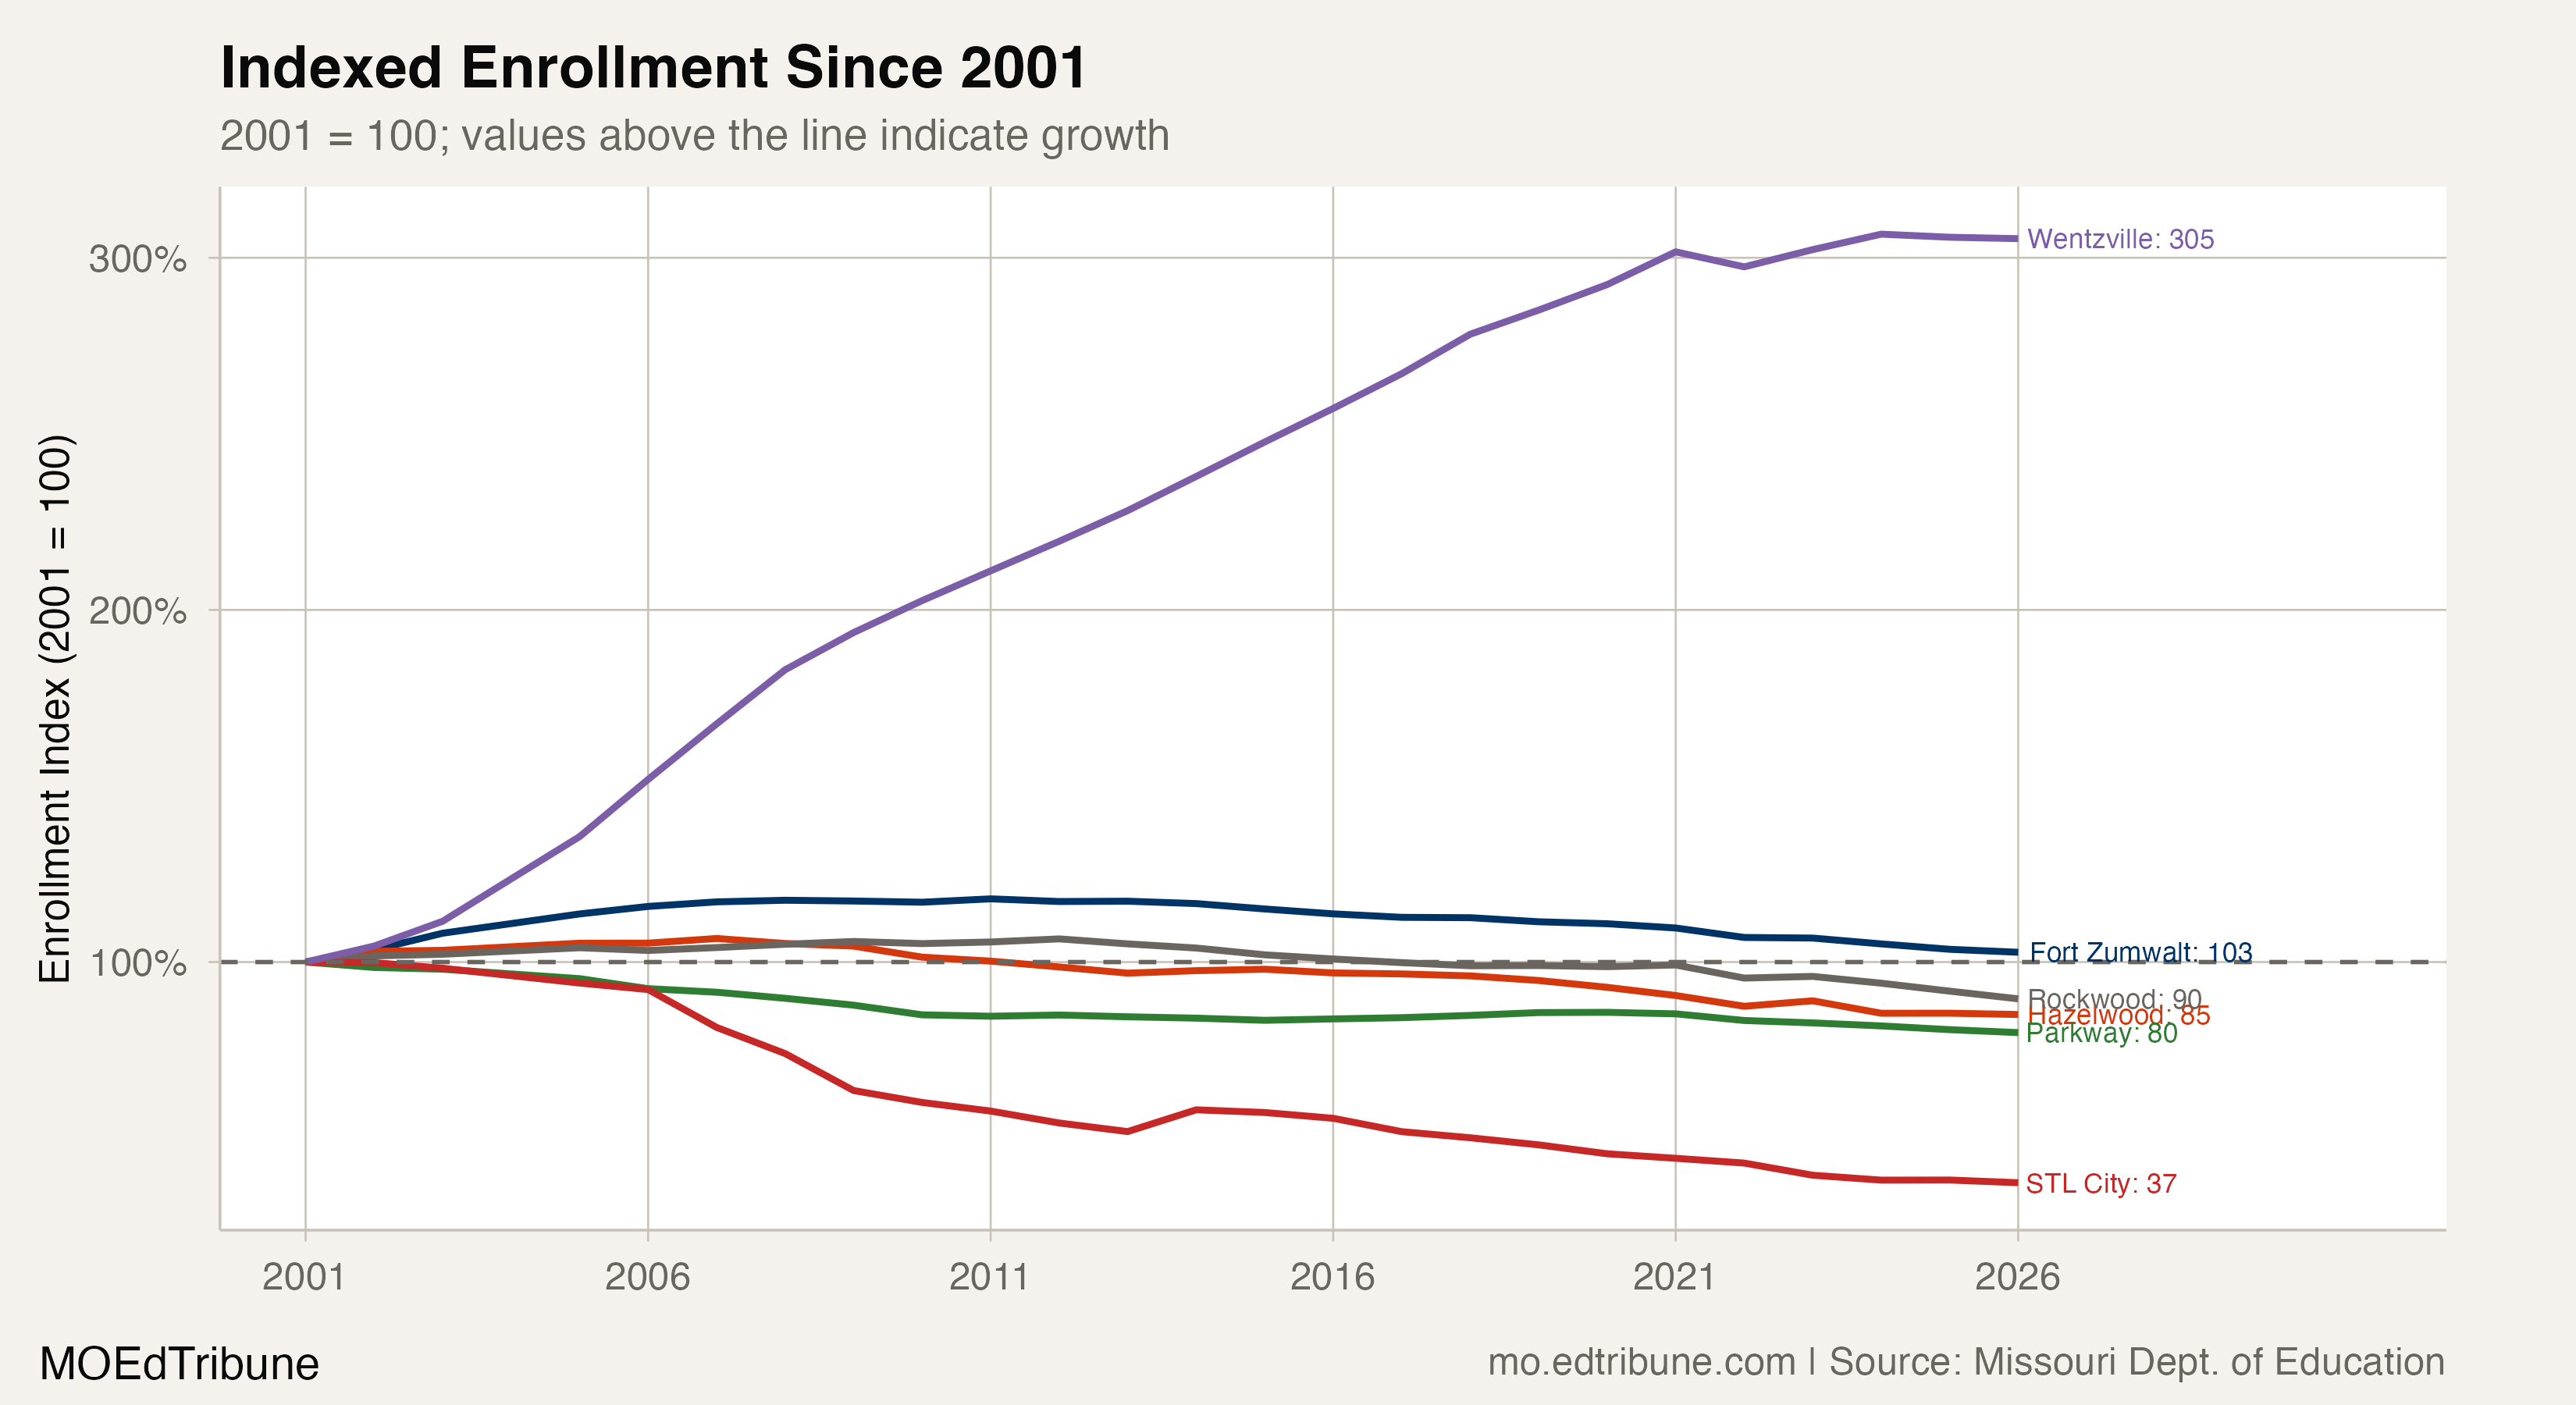
Wentzville↗ET reported 6,003 students in 2000-01 while Parkway↗ET reported 20,231. By 2021-22, Wentzville’s published count exceeded Parkway’s. In preliminary 2025-26, last school year and the most recent year in these files, Wentzville reported 17,375 students, up 189.4% from the starting endpoint. Parkway reported 16,237, down 19.7%.
Every district comparison here uses its published kindergarten-through-12th-grade total, excluding preschool, for each year from 2000-01 through preliminary 2025-26. All named districts have complete counts throughout that window. Enrollment counts do not establish which families moved or why.
Five observed minima in the named inner group
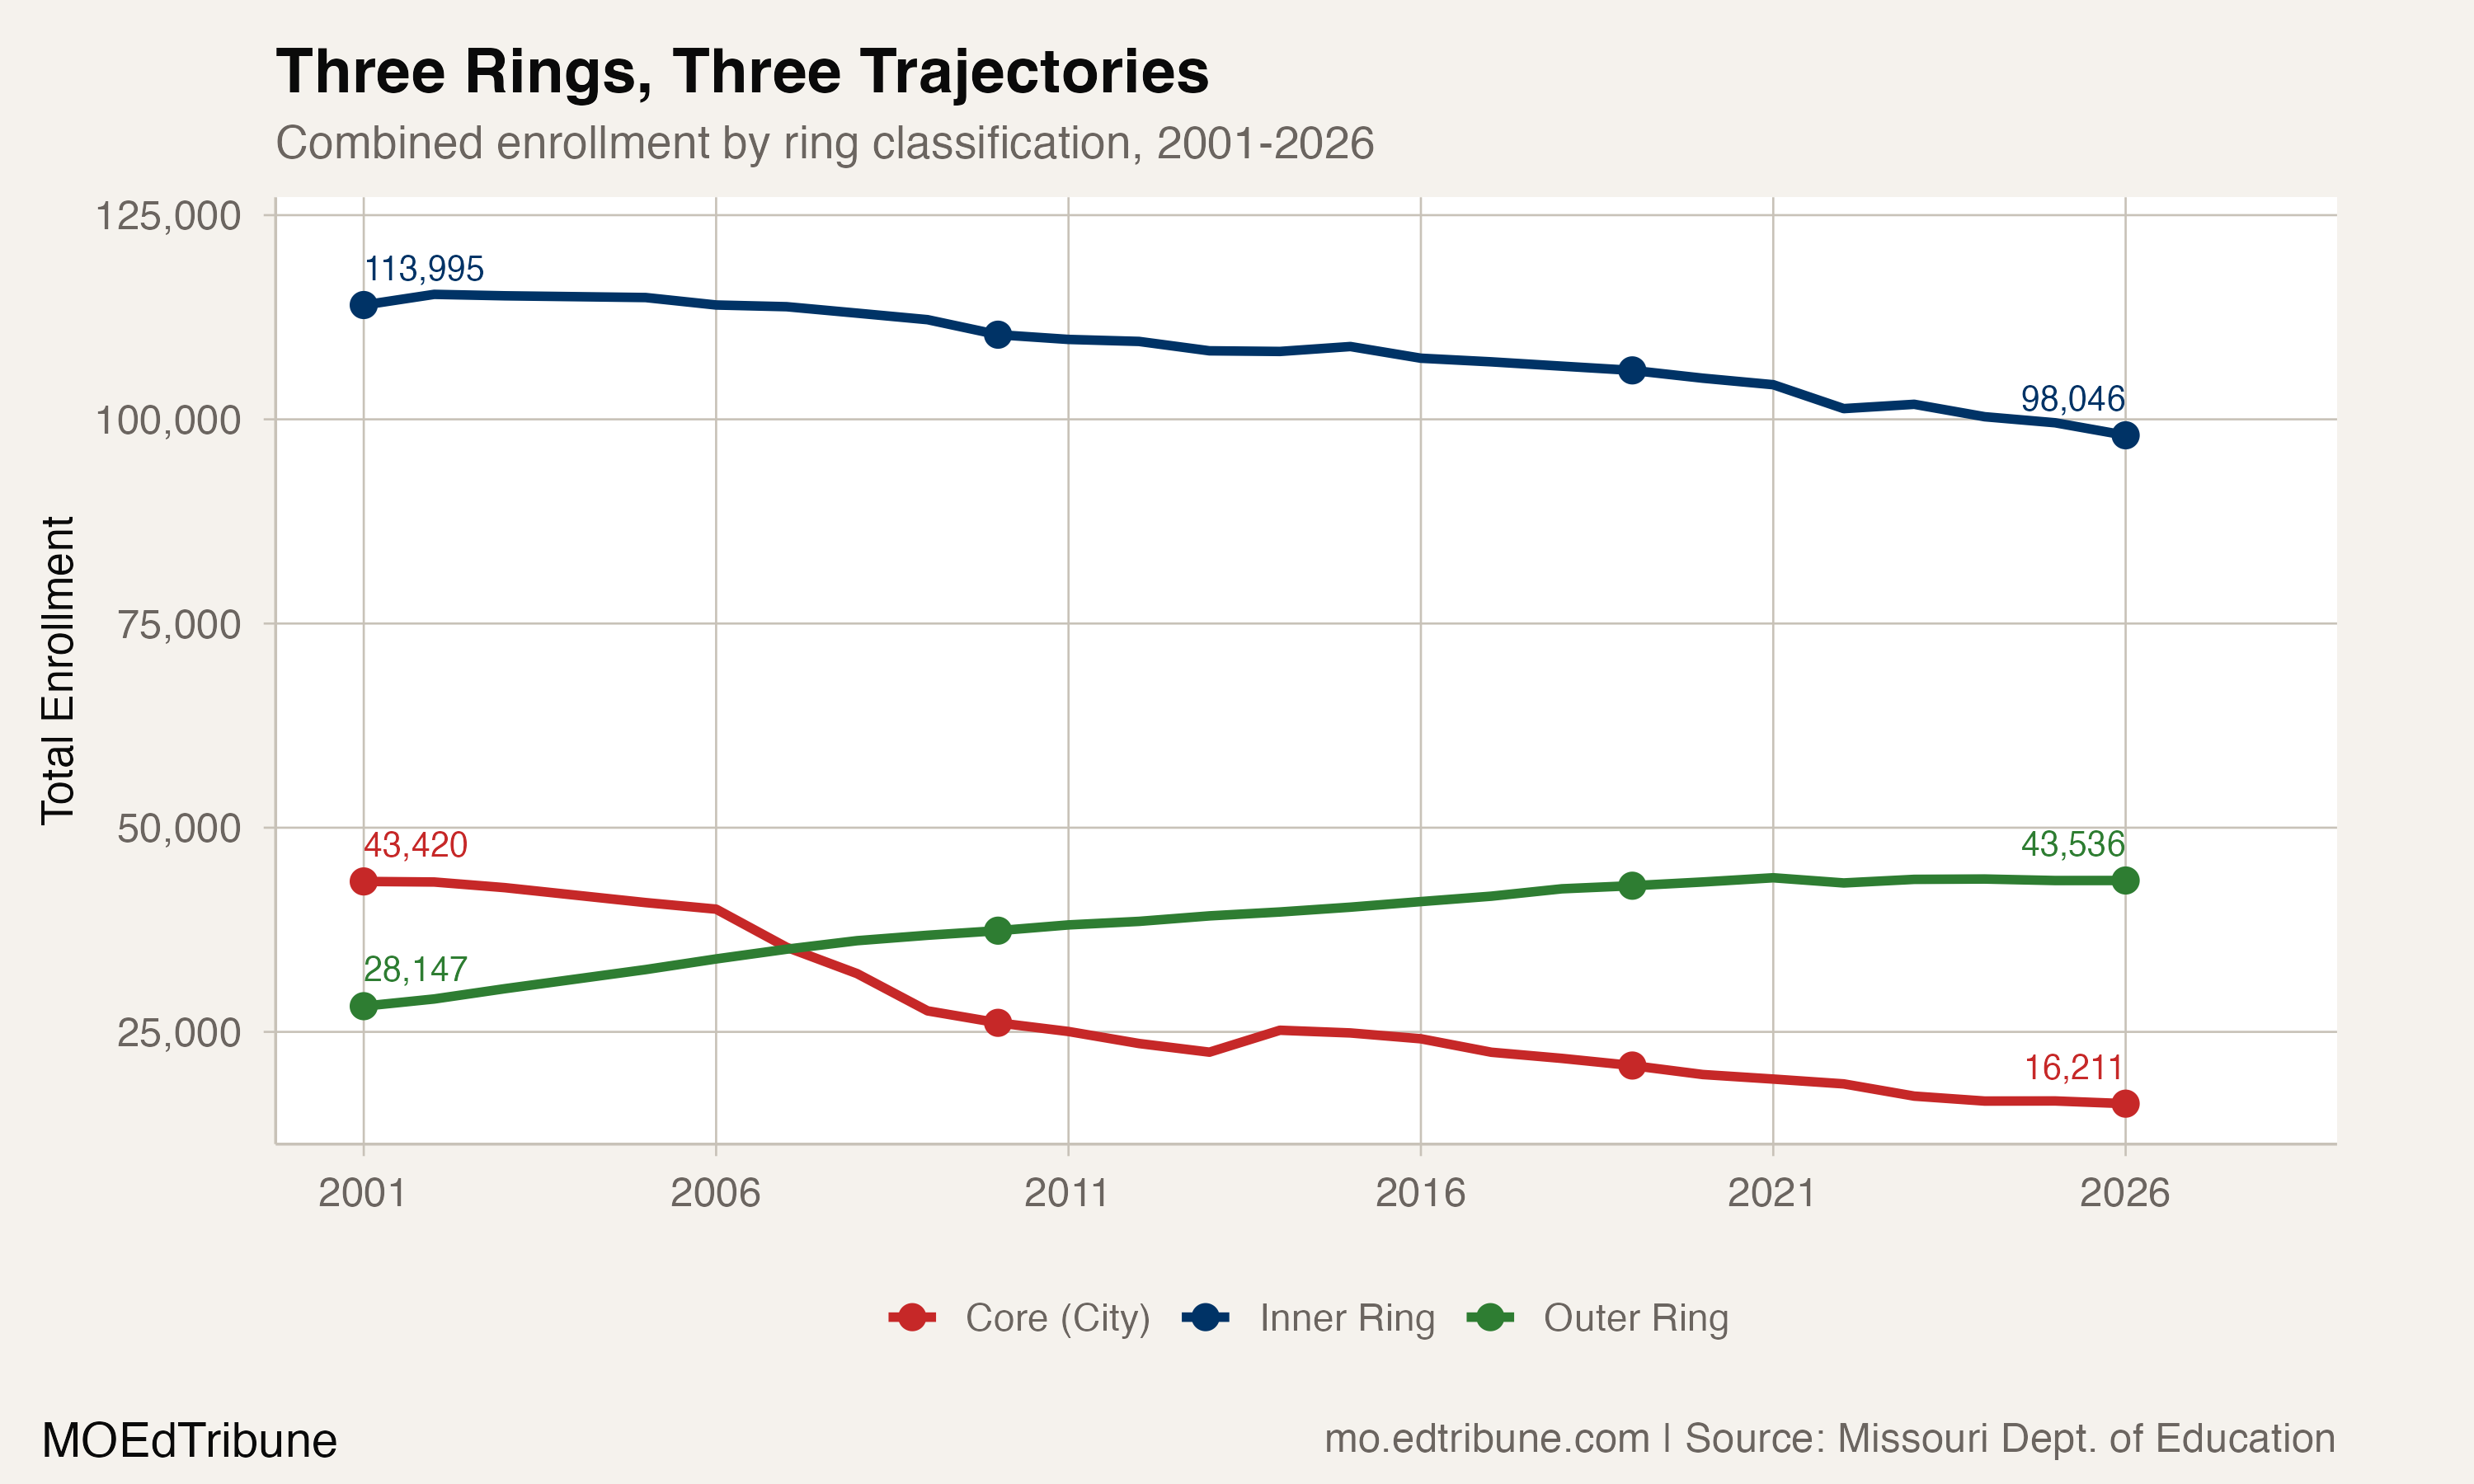
This article’s inner group comprises Parkway, Hazelwood, Rockwood, Ferguson-Florissant, Francis Howell, Mehlville, Affton, Kirkwood and Webster Groves. Its outer group comprises Wentzville, Lindbergh↗ET, Fort Zumwalt and Orchard Farm. St. Louis City is shown separately. These labels apply only to those lists; they do not define every district in a county or the region.
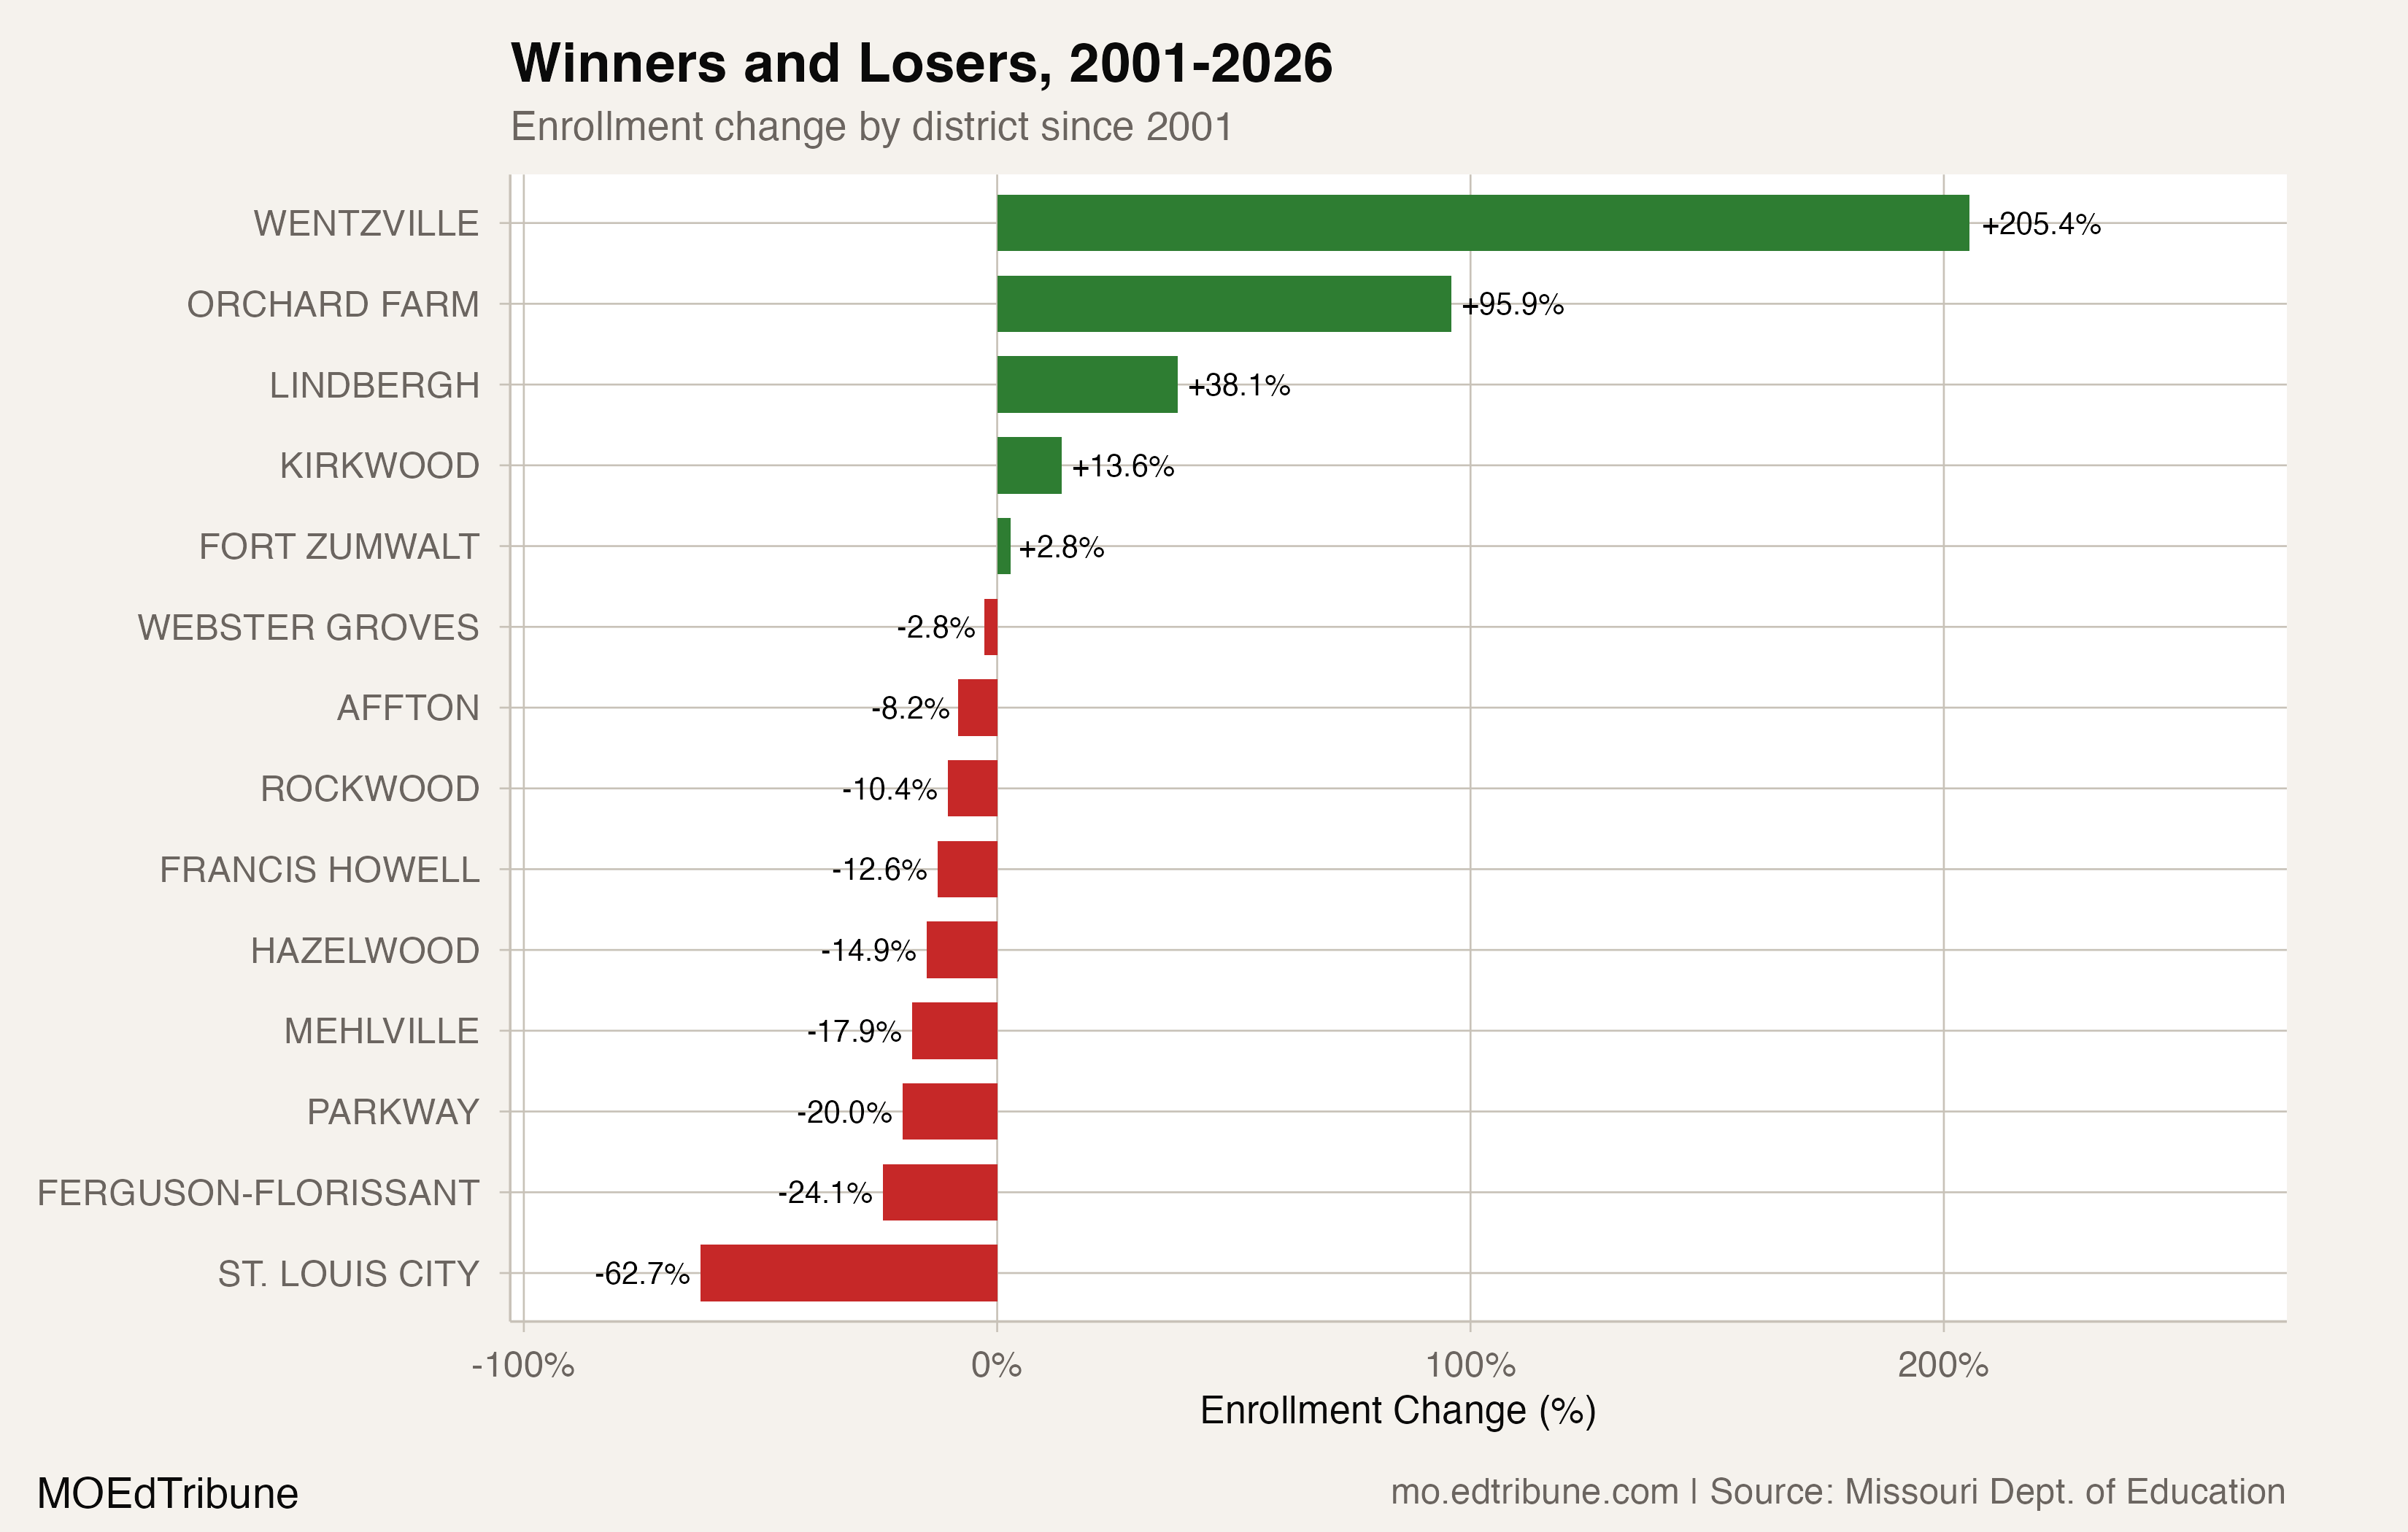
Of the nine named inner districts, five reached their lowest observed count within the 26-year window in preliminary 2025-26: Parkway, Rockwood↗ET, Mehlville↗ET, Francis Howell↗ET and Webster Groves↗ET. That is a fixed-window comparison, not a claim about years outside these records.
Ferguson-Florissant↗ET declined 27.8% between the endpoints, the largest percentage decline among those nine. Mehlville declined 20.6%. Hazelwood↗ET declined 3,213 students, or 17.0%. Rockwood, the largest district in the declared group at the final endpoint, had an observed maximum of 22,568 in 2010-11 and reported 18,595 in preliminary 2025-26.
Francis Howell’s highest observed count was 18,831 at the first endpoint and its lowest was at the last, a 13.3% decline. Wentzville’s preliminary count exceeded Francis Howell’s by 1,047 students.
The other four inner districts were not at their observed minimum: Kirkwood↗ET grew 10.1% between endpoints; Affton’s minimum came in 2013-14; and Hazelwood and Ferguson-Florissant had minima in 2024-25 before gains of 75 and 44 students, respectively.
Complete group arithmetic
The nine named inner districts declined 18,351 students, or 15.9%, between the endpoints. The four named outer districts gained 14,044, or 48.4%. That gain was arithmetically equal to 76.5% of the inner group’s loss; it does not identify where any of those students came from. St. Louis City separately declined 26,430 students, or 62.9%, the largest percentage decline within this declared set.
Combined, the 14 named districts went from 186,318 students to 155,581, a decline of 30,737, or 16.5%. Those are sums of a complete, fixed list of published district totals. They are not statewide totals or a complete metropolitan enrollment count.
Two observed peaks
Fort Zumwalt↗ET reached an observed maximum of 18,840 students in 2009-10. Its preliminary 2025-26 count was 16,099, down 2,741 from that peak, or 14.5%, and its lowest count in this window. Wentzville first exceeded its reported count in 2021-22.
Wentzville’s observed maximum was 17,611 in 2022-23. Its count declined in each of the three subsequent annual comparisons, by 236 students in total. Fort Zumwalt’s observed peak preceded Wentzville’s by 13 years. The named outer group was 795 students below its own observed maximum, reached in 2019-20.
These different peak years and subsequent losses are measurable. They do not, by themselves, establish a common cause or predict a shared future decline.
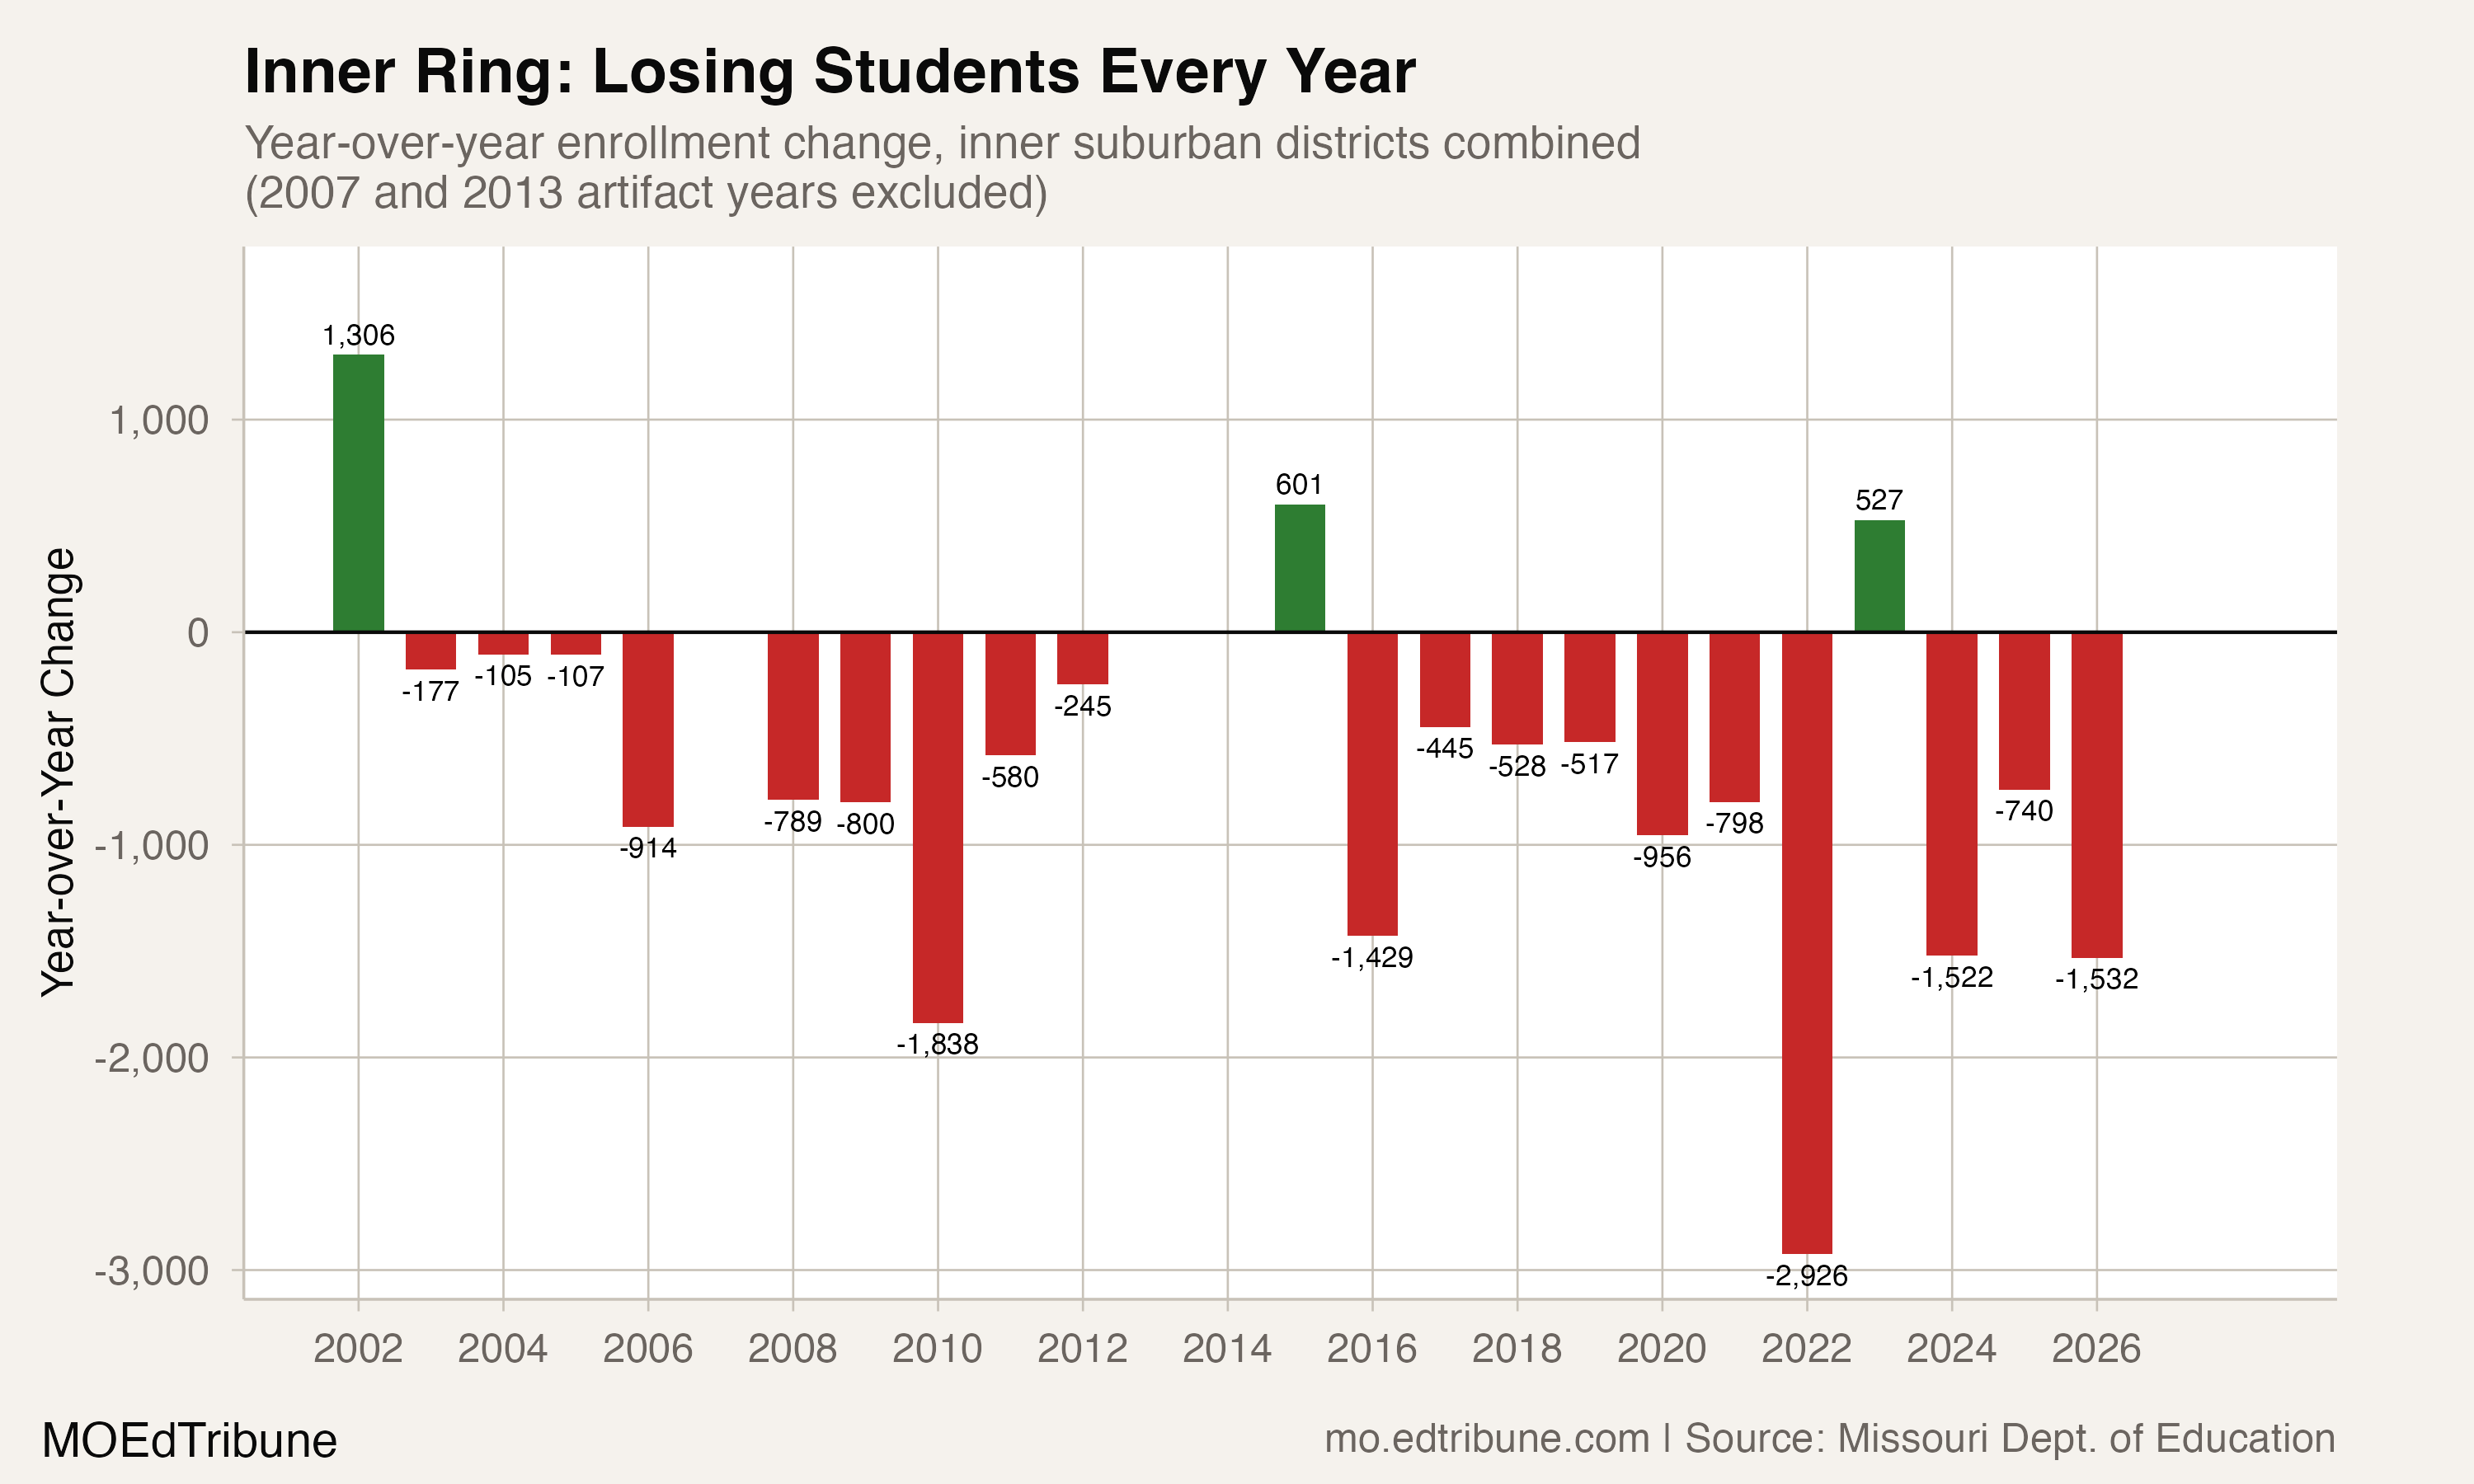
Annual changes in the complete inner group
The inner group declined in 23 of its 25 annual transitions. Its largest annual loss in this window was 2,908 students in 2020-21. The following year brought a gain of 509; every subsequent annual comparison was negative, including losses of 1,670 in 2024-25 and 957 in preliminary 2025-26. No statewide comparison is inferred from those group counts.
Attributed perspectives, separate from the counts
Ness Sandoval offered this perspective in a St. Louis Public Radio report: "We just have fewer children that are being born. And I think we're going to continue to see a decline because the birth rates are not increasing."
Robert Dillon described a possible fiscal mechanism to the St. Louis Post-Dispatch, in a report archived by University City Schools: "The loss of enrollment creates a death spiral where you have less funding, which leads to less staff, which leads to less programs, and people start to look at other places."
Those are attributed perspectives. This enrollment comparison does not measure births, migration, household age, funding changes or program cuts, and it does not test whether those mechanisms explain the named districts’ counts.
Enrollment figures come from the Missouri Department of Elementary and Secondary Education’s district and building enrollment files. Counts for 2025-26 are preliminary. Inner and outer labels refer only to the fixed district lists named here.
Detailed code that reproduces the analysis and figures in this article is available exclusively to EdTribune subscribers.
Discussion
Sign in to join the discussion.
Loading comments...