Blair Oaks stayed below Missouri's statewide chronic absence rate throughout the comparison window. Yet its own rate was higher at the end than at the beginning. That distinction runs through a much larger group of district-level reports.
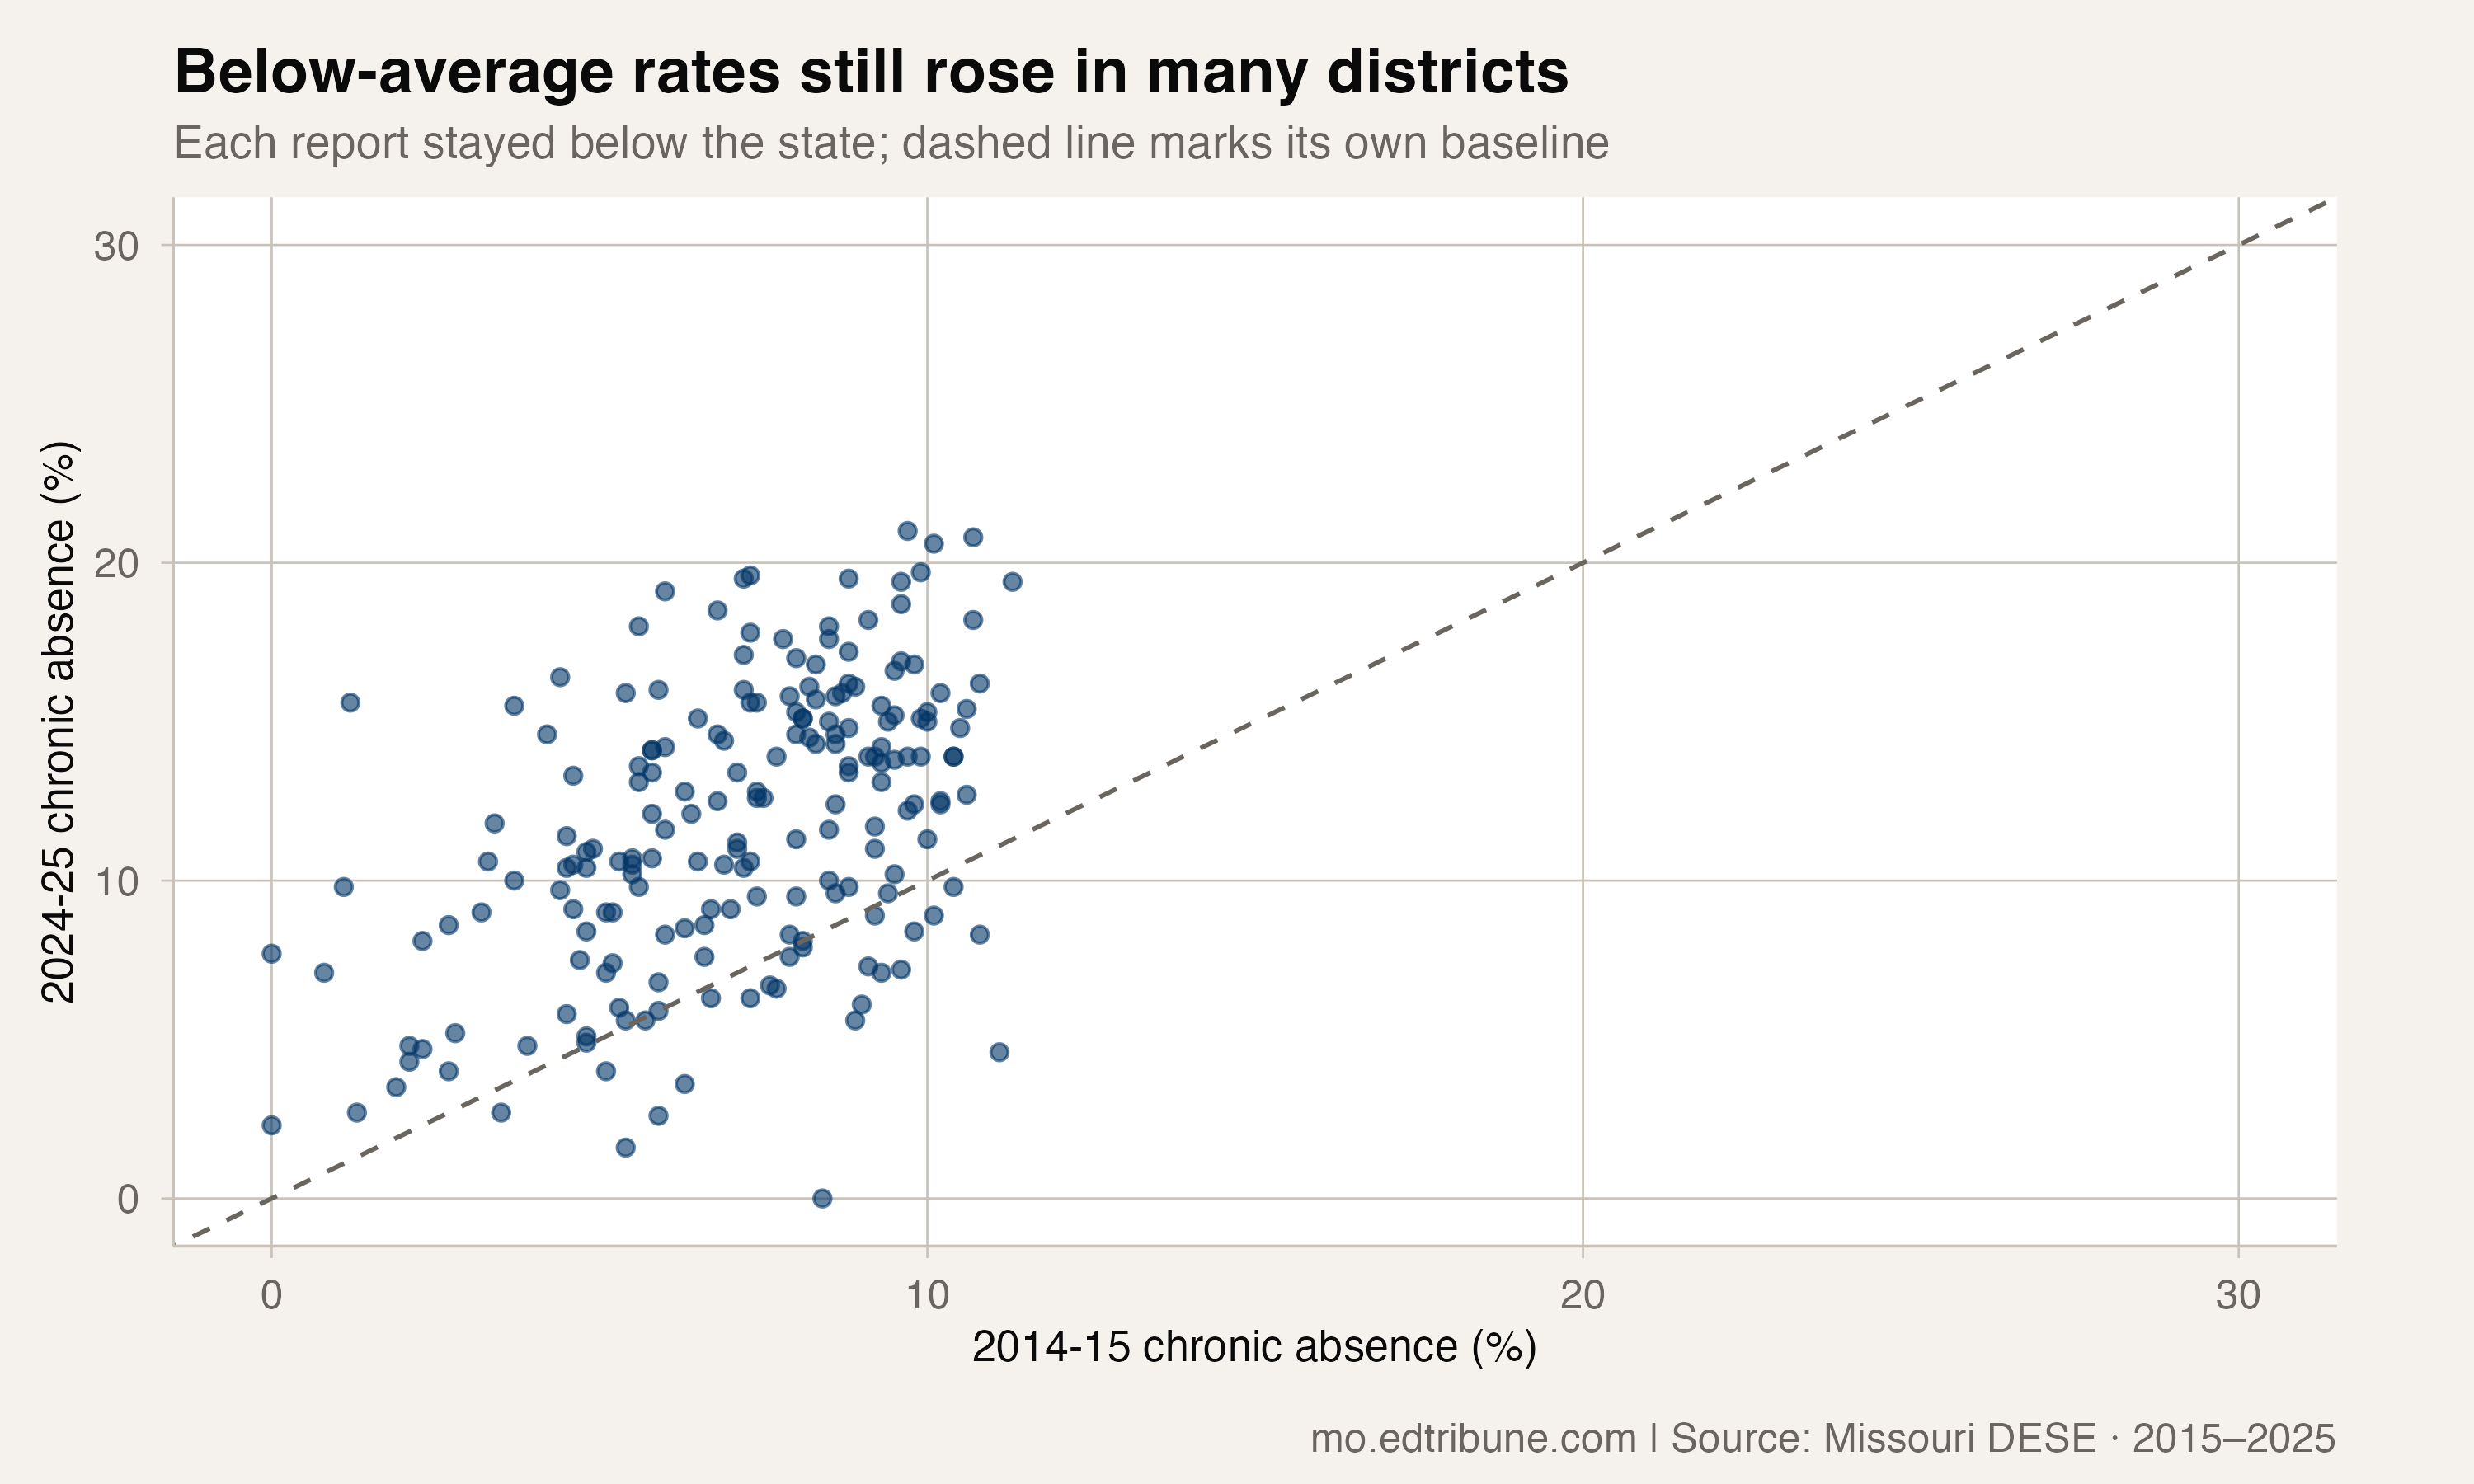
Across 11 reporting years, from 2014-15 through 2024-25, 195 reports stayed below the state's published rate every year. Of those, 169 ended the window with higher absence rates than they had at the start.
“Below average” describes relative standing. It does not necessarily describe improving attendance.
A complete comparison
The comparison includes 546 district-level reports with a finite all-student absence rate in every reporting year. It uses stable district identifiers and the published statewide rate for each year. The reporting universe includes charter systems as well as geographic school districts.
The data come from Missouri DESE's attendance reports, distributed through the PRiME Center's education data collection.
Missouri's statewide rate was 11.4% in 2014-15. It reached a window peak of 23.8% in 2021-22 and fell to 21.5% in 2024-25, the most recent published year in this comparison.
A district could therefore remain below the statewide rate while its own rate rose. Comparing districts with the state and comparing them with their own earlier attendance are different questions.
Some persistently low rates
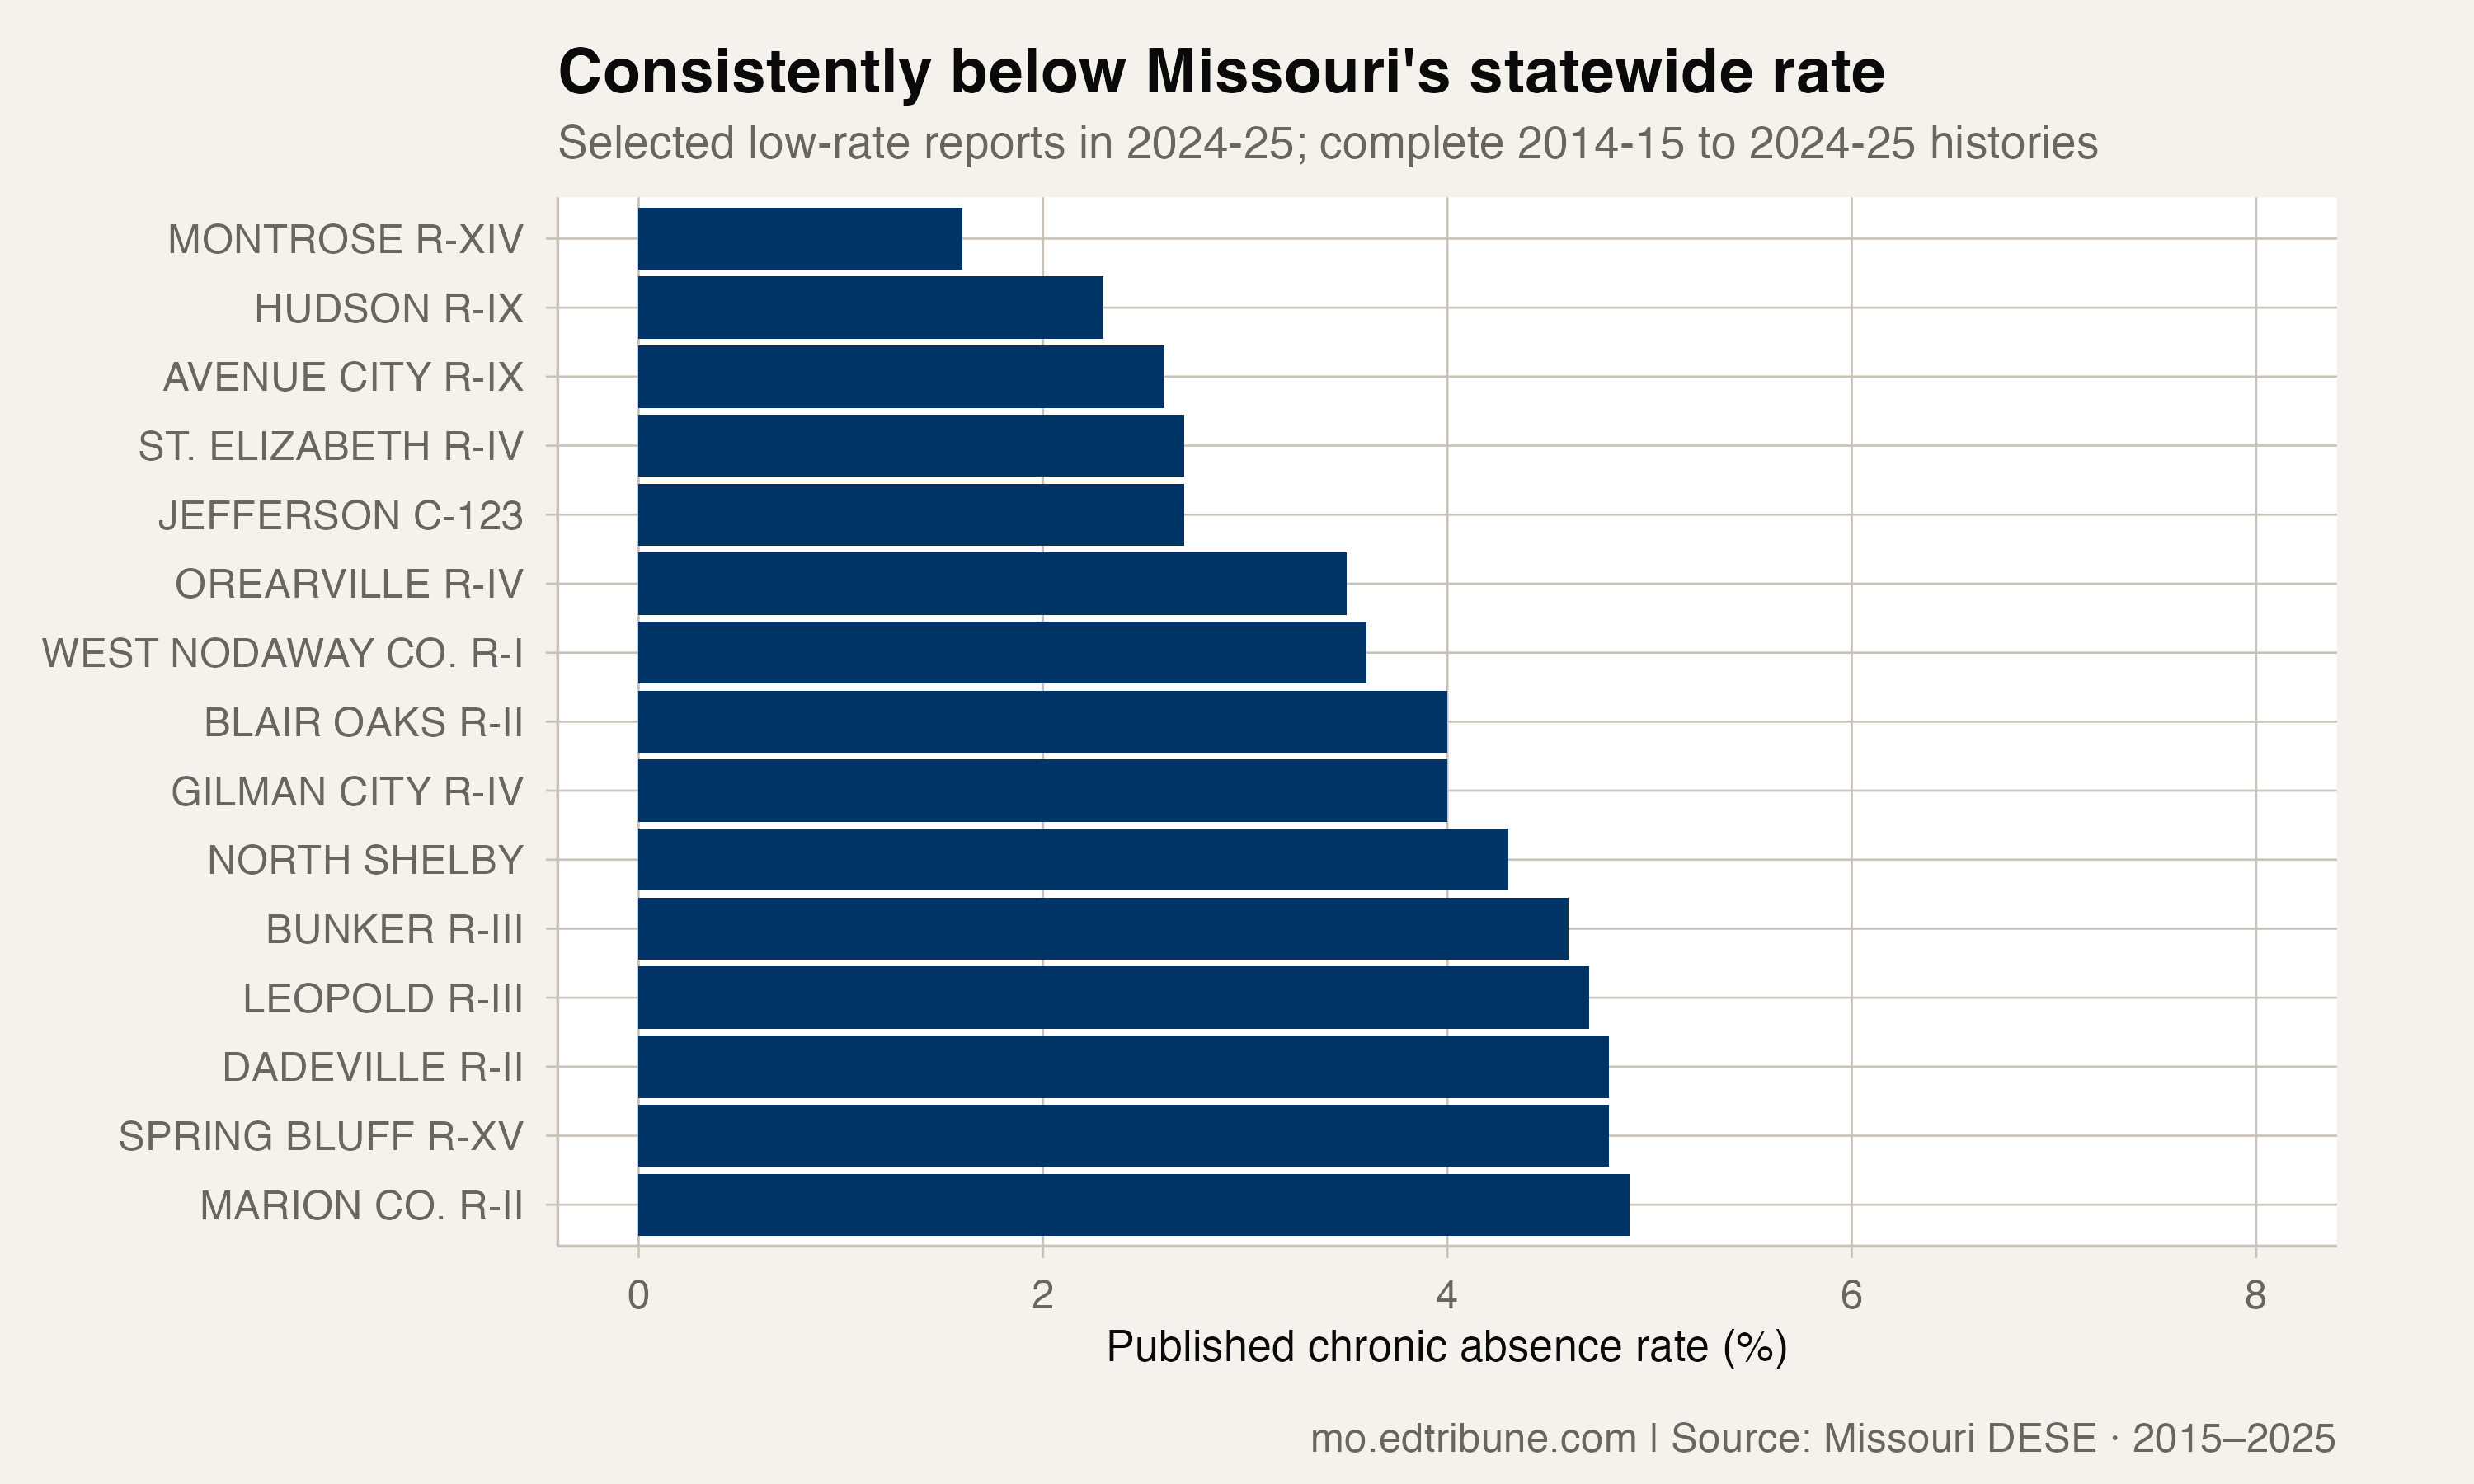
Montrose R-XIV reported a chronic absence rate of 1.6% in 2024-25. Hudson R-IX was at 2.3%, Avenue City R-IX at 2.6%, and both St. Elizabeth R-IV and Jefferson C-123 at 2.7%. Each stayed below the state comparison throughout the window.
Blair Oaks R-II↗ET reported 4.0% in the most recent year. Its trajectory remained below Missouri's even as both rates changed over time.
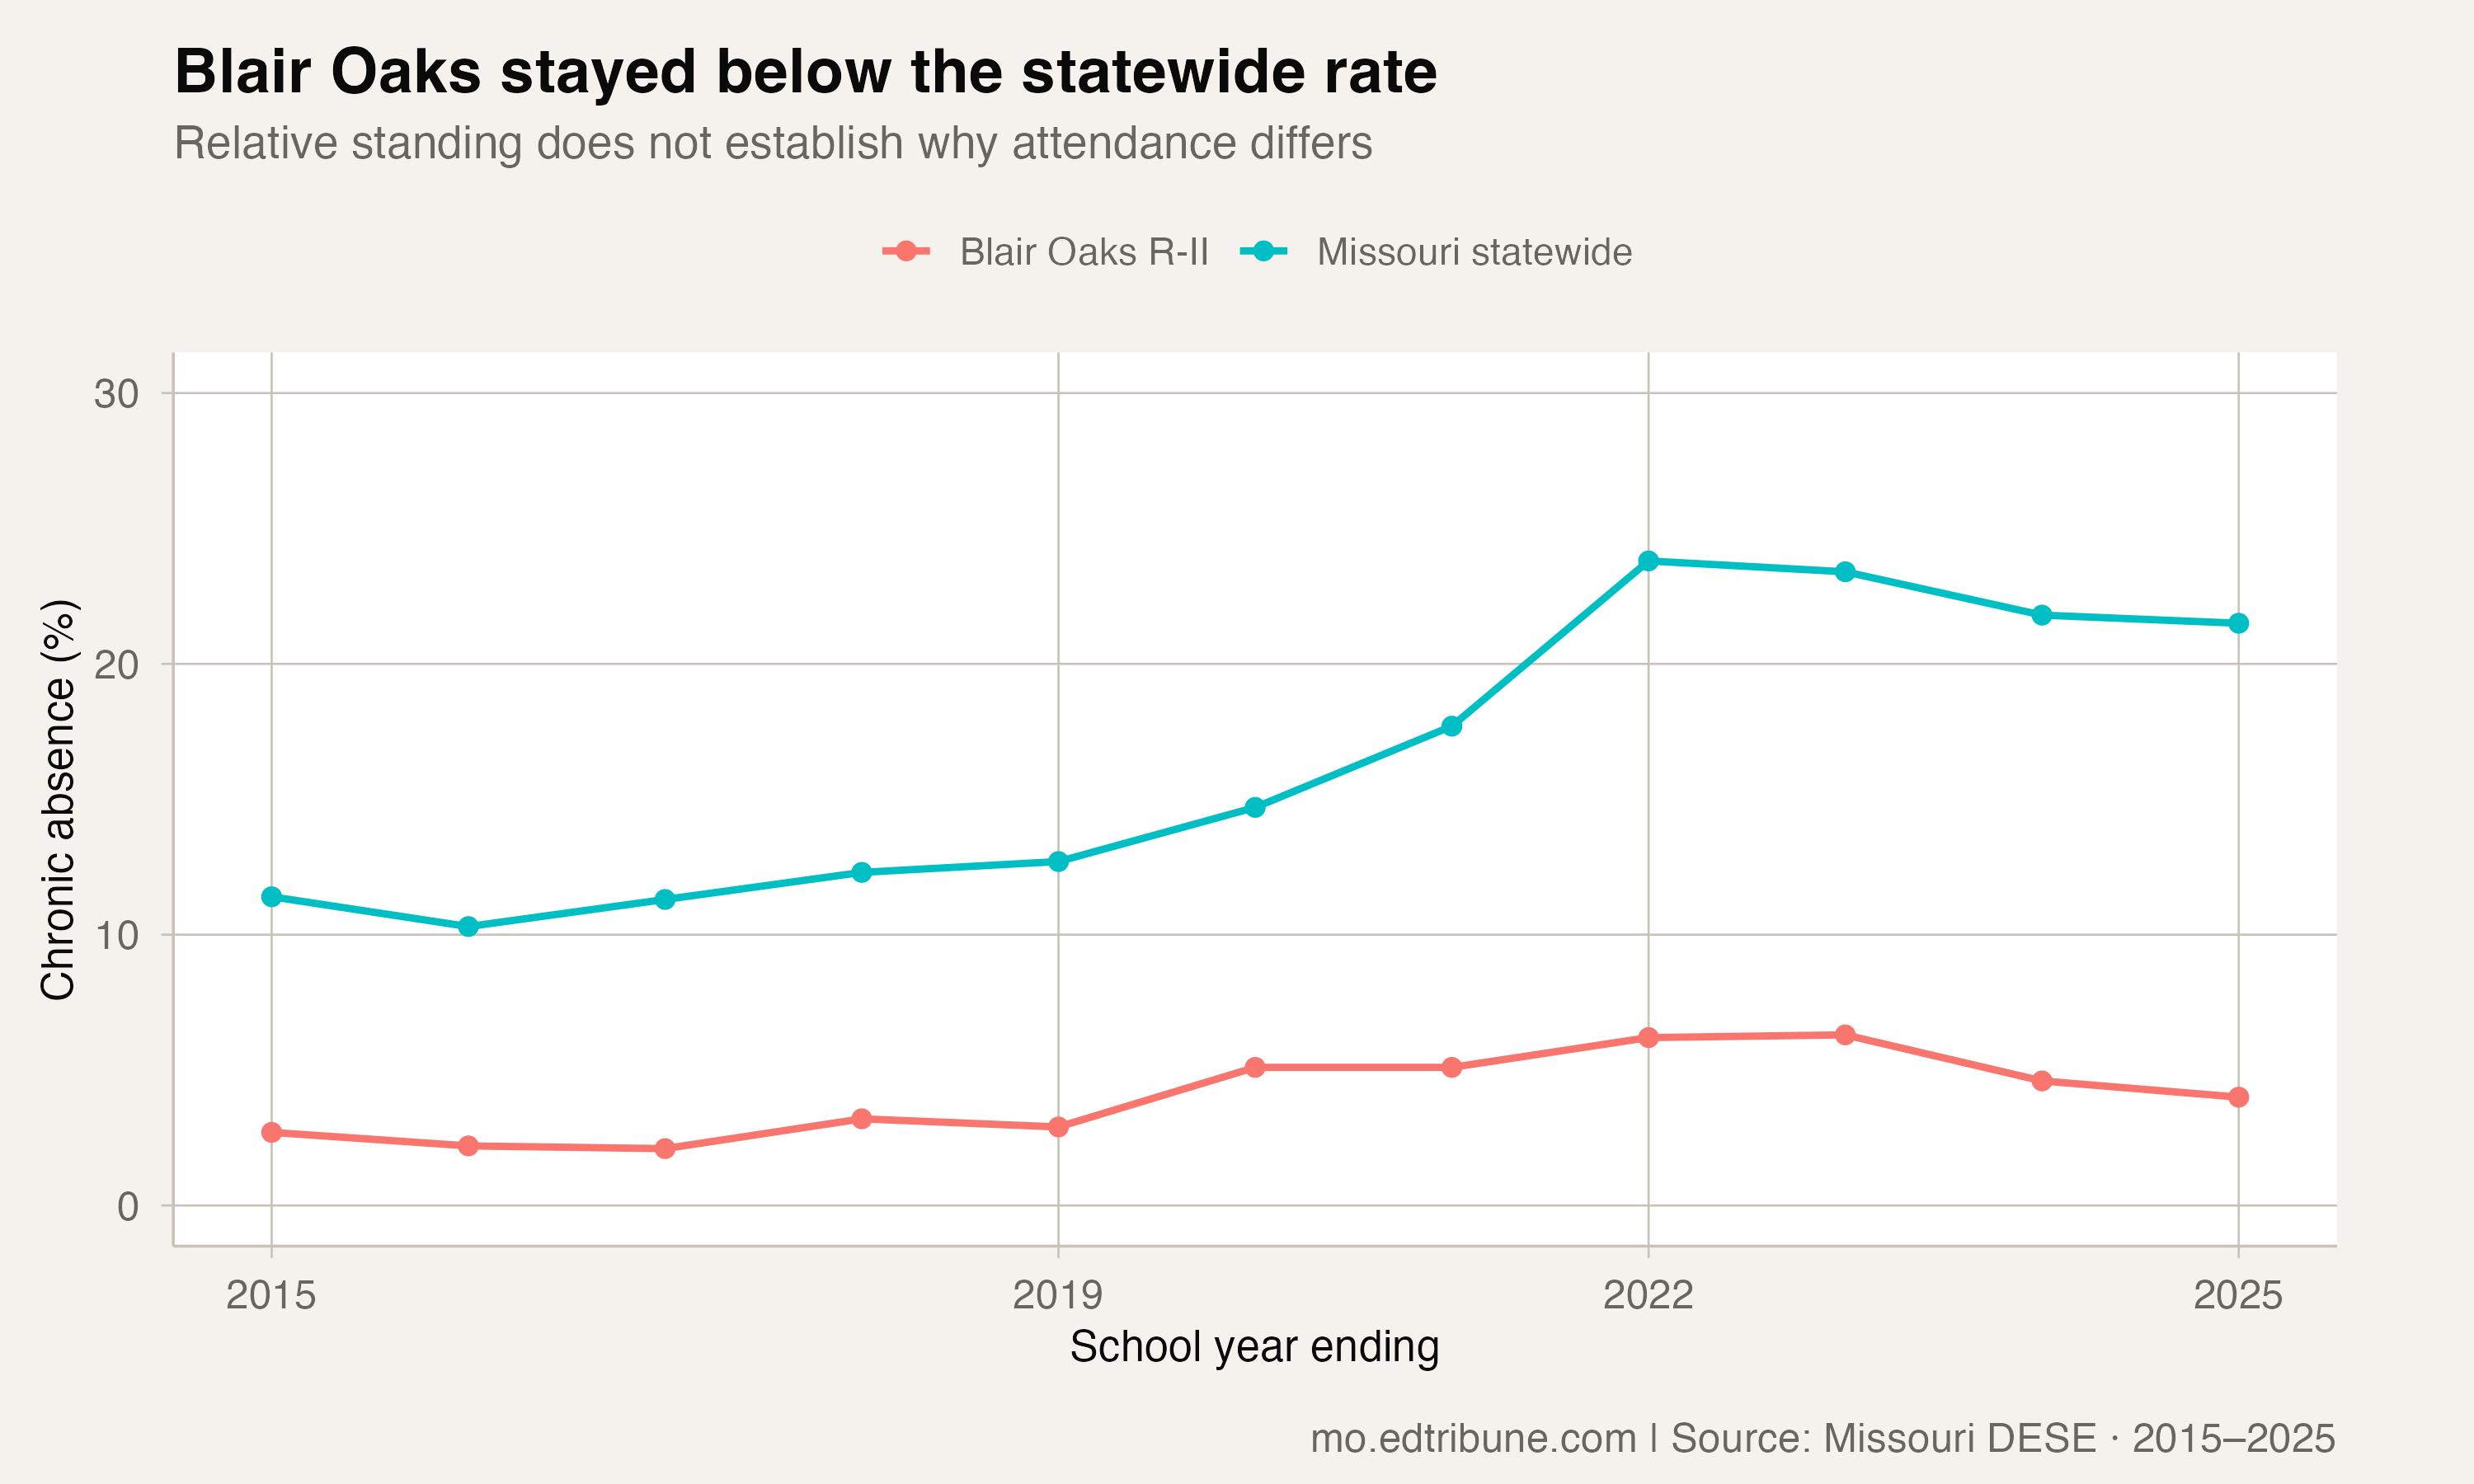
These results identify sustained relative differences. The attendance files do not record whether family relationships, transportation, staff continuity or district programmes produced them. They also do not supply a matching enrollment count for this attendance comparison, so the results cannot establish that small districts were more likely to qualify.
Lower than the state can still mean substantial absence
Bayless reported 17.0% in 2024-25, Pleasant Hill R-III 16.9%, and Republic R-III 16.8%. All qualified under the same strict comparison: their rate was below the statewide rate in every reporting year.
Those rates were below the state, but they were not close to zero. Describing these reports as universally successful would obscure that difference.
The mean of the qualifying reports' individual peak rates was 15.5%; their median peak was 16.0%. These are summaries of district-level peaks, rather than a statewide student absence rate.
What the comparison can establish
The group provides examples of districts that consistently reported lower absence than the statewide benchmark. It also shows the limits of that benchmark: most of the qualifying reports had a higher rate at the end of the window than at the beginning.
An attendance strategy cannot be identified from a rate alone. The useful next question for these districts is what changed locally, including where relative success coexisted with deterioration against their own earlier record.
Detailed code that reproduces the analysis and figures in this article is available exclusively to EdTribune subscribers.
Discussion
Sign in to join the discussion.
Loading comments...