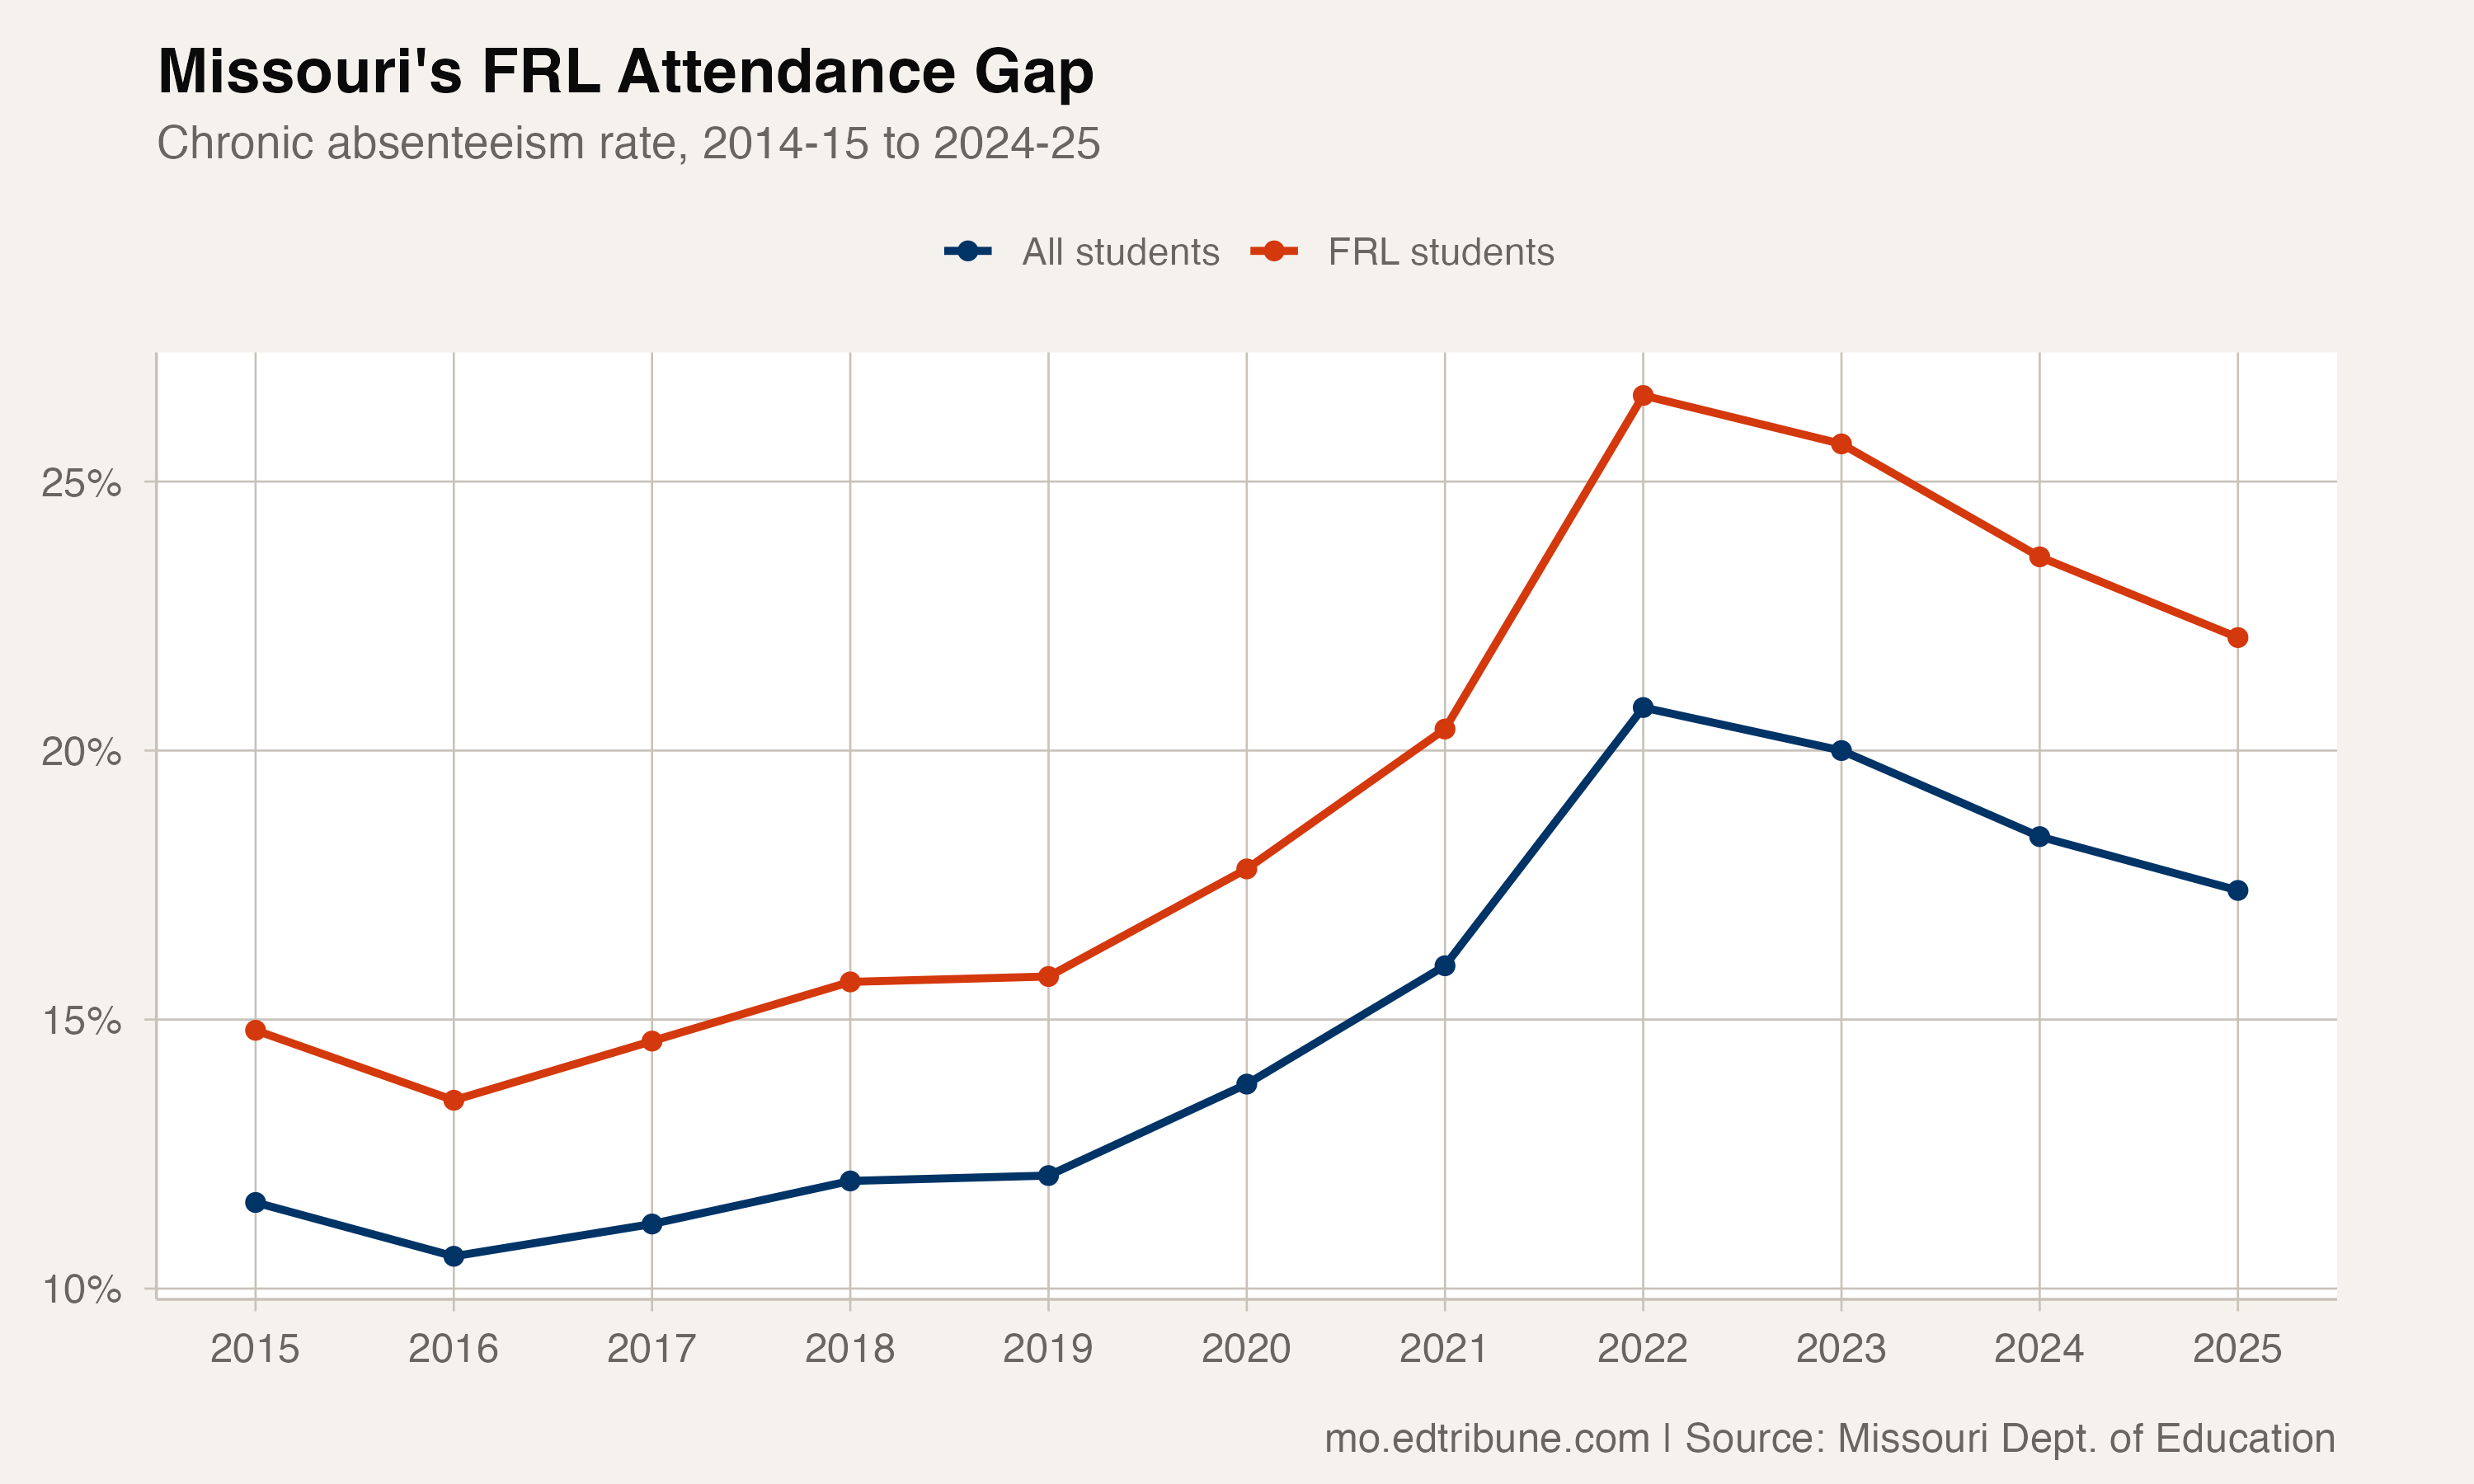
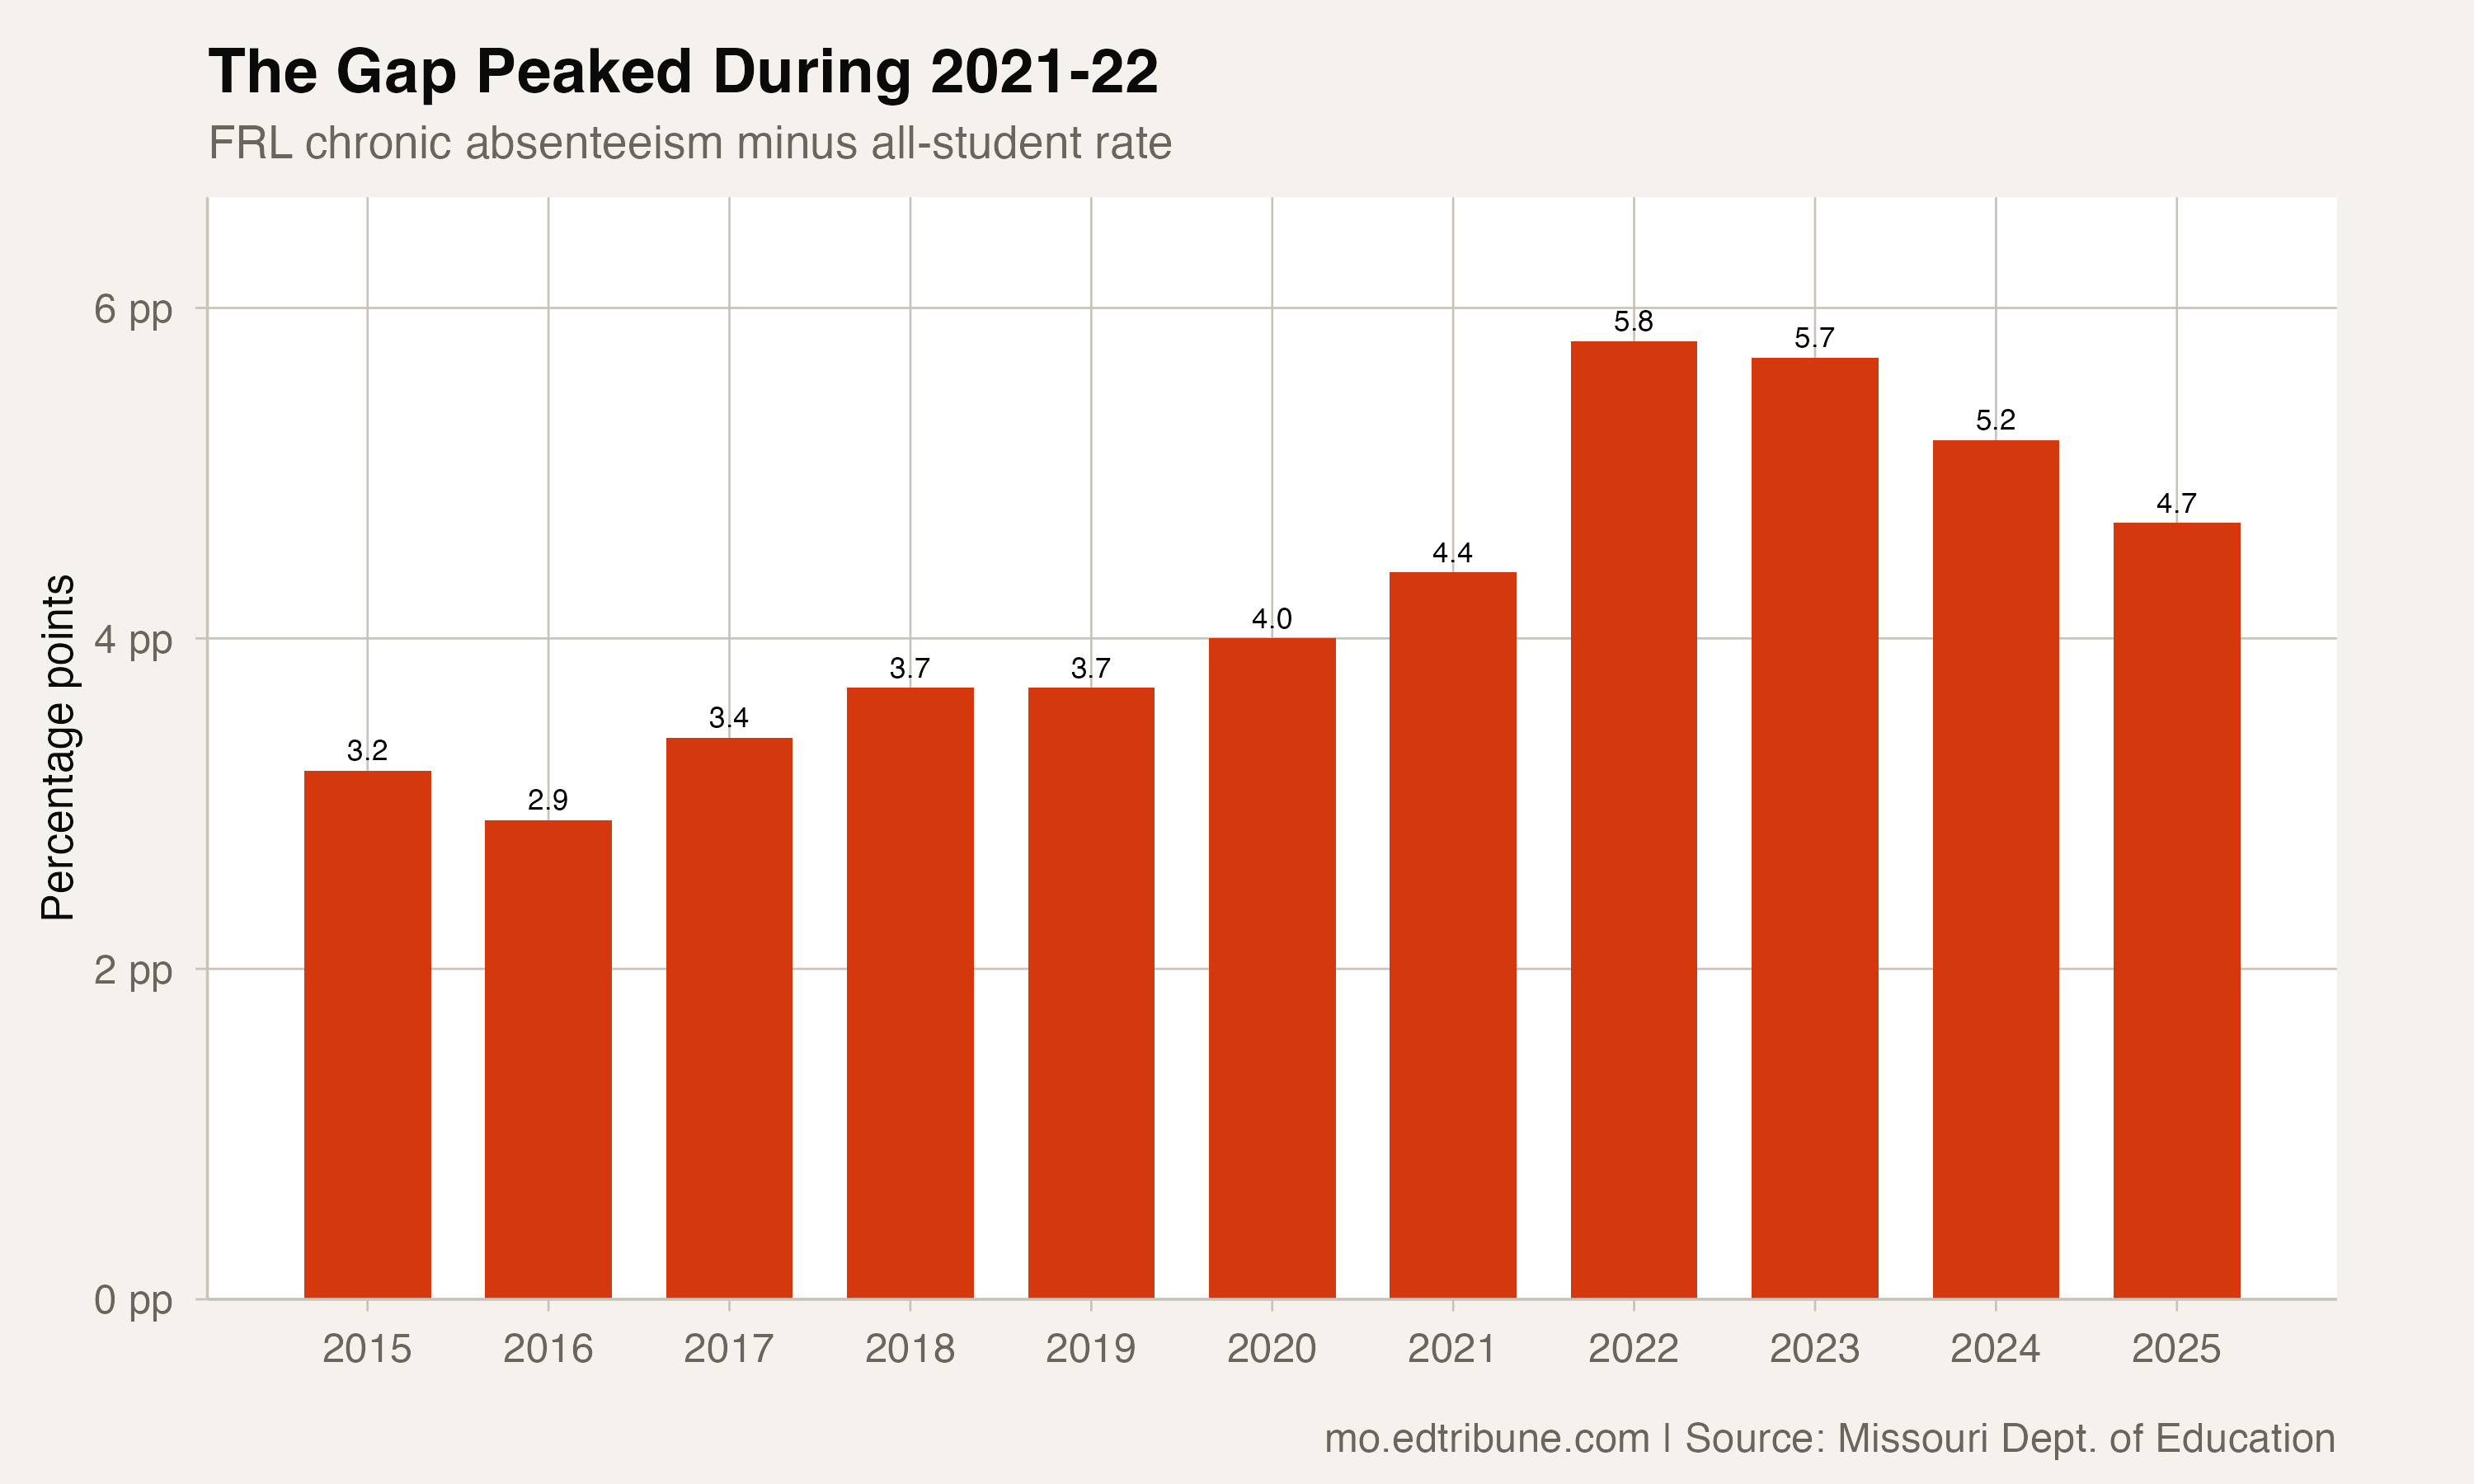
Correction (September 19, 2026): An earlier version of this article reported statewide chronic absenteeism rates that were an unweighted average of district rates rather than Missouri's published statewide rates. That average counts a small rural district the same as Kansas City, and it understated both rates. On the published figures, the 2024-25 rates are 30.1% for FRL students and 21.5% overall, a gap of 8.6 percentage points, not 22.1%, 17.4% and 4.7. The 2014-15 gap was 4.7 points, not 3.2, and the 2021-22 peak was 10.4 points, not 5.8. The district figures were not affected. The finding that the gap is wider than it was in 2014-15 stands, and it is larger than first reported.
Missouri's published attendance data show a persistent difference between the chronic absenteeism rate for free and reduced-price lunch (FRL) students and the all-student rate. The FRL rate was higher in every available state year, but the data do not identify why the gap differs.
In 2014-15, the FRL chronic absenteeism rate was 16.1%, compared with 11.4% overall, a gap of 4.7 percentage points. By 2024-25, the rates were 30.1% and 21.5%, respectively, a gap of 8.6 points. The gap peaked at 10.4 points in 2021-22 and has narrowed since, but it remains 83.0% wider than it was in 2014-15.
A gap that widened across most transitions
The FRL gap widened across six of the 10 year-to-year transitions in the 2014-15 through 2024-25 panel. It was 4.7 points in 2014-15, dipped to 4.3 in 2015-16, then rose every year: 4.8, 5.3, 5.8, 6.1 and 7.1 points. It hit 10.4 points in 2021-22, when FRL chronic absenteeism reached 34.2% compared with 23.8% overall. It has fallen in each year since, to 9.4, 8.9 and 8.6 points.
Three districts show large within-district gaps
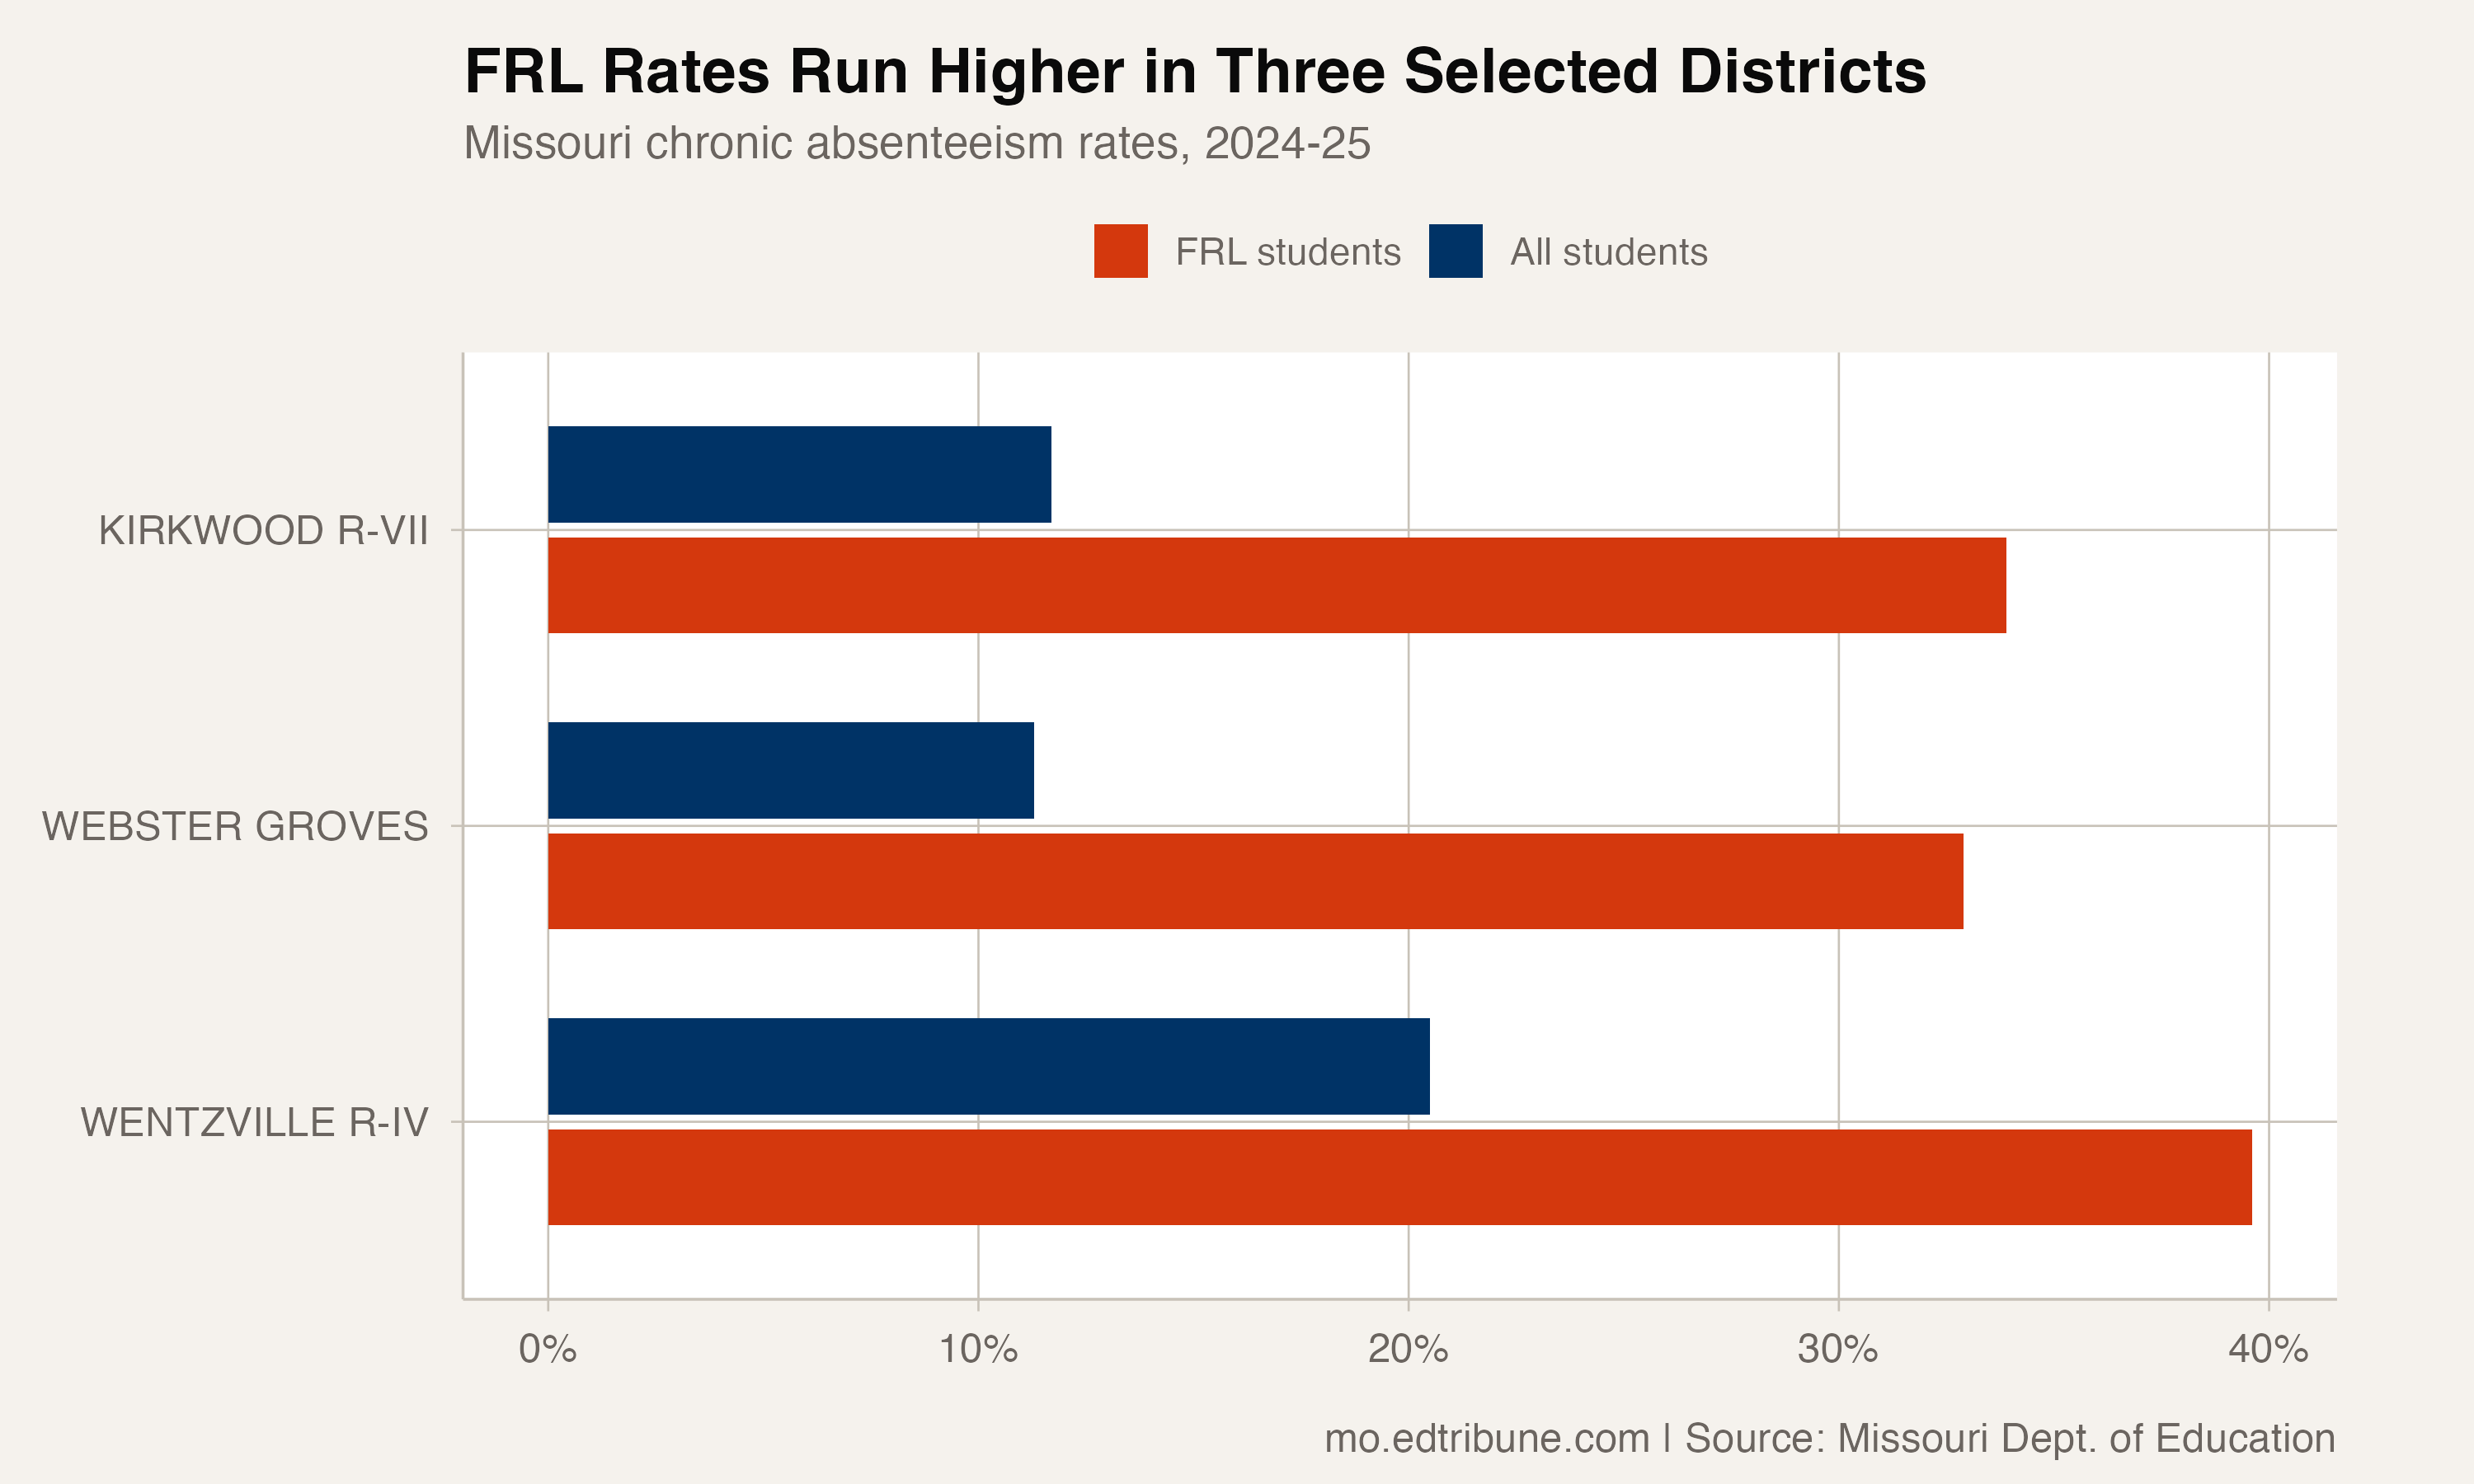
In the selected district comparison, Kirkwood↗ET's overall chronic absenteeism rate was 11.7%, compared with 33.9% for FRL students, a gap of 22.2 percentage points. Webster Groves↗ET had an 11.3% overall rate and a 32.9% FRL rate, a 21.6-point gap. Wentzville↗ET had a 20.5% overall rate and a 39.6% FRL rate, a 19.1-point gap.
Within Kirkwood, the FRL rate was 2.9 times the all-student rate. That is a comparison of reported subgroup rates, not evidence about the cause of the difference.
Smaller gaps elsewhere
Not every district had a positive FRL gap. Of the 548 districts that reported both rates for 2024-25, 105 had an FRL rate at or below their overall rate. The data do not identify why those district-level gaps differ, so this article does not assign a cause.
What drives the gap
The district attendance data used here report chronic absenteeism for all students, FRL students and two grade spans. They do not break it out by race, gender or special education status. FRL is the subgroup comparison used here. It does not capture every circumstance that can affect attendance.
What the data can and cannot show
The attendance data cannot identify how funding policy affects the gap. What they do show is an 8.6-point difference in 2024-25 after a 10.4-point peak in 2021-22. The gap was still wider than in 2014-15 at the end of the panel.
The 2024-25 gap ranked fourth among the 11 available years. The data establish the size and timing of the difference; they do not establish whether it will narrow in a future year or what intervention would change it.
The chronic-absence figures reported here are the complement of Missouri's published proportional attendance rates. Statewide rates are the published statewide figures from the Missouri Department of Elementary and Secondary Education; district rates come from the same department's district attendance data.
Detailed code that reproduces the analysis and figures in this article is available exclusively to EdTribune subscribers.
Discussion
Sign in to join the discussion.
Loading comments...