Correction (September 19, 2026): An earlier version of this article said Missouri's statewide chronic absenteeism rate was 17.1% in 2024-25 and that even the lowest rate among the eight districts was more than twice that figure. The 17.1% was an unweighted average of district rates, which counts a small rural district the same as St. Louis City. Missouri's published statewide rate for 2024-25 is 21.5%, and the lowest rate in the tier, 39.6%, is 1.8 times that. The article also said the statewide rate's largest annual change was 4.8 points; on the published series it is 6.1 points, entering 2021-22. The district figures and rankings were not affected.
Correction (October 8, 2026): An earlier version described an attendance threshold that this computation did not independently establish. This version states the verified relationship between the two published rate columns and distinguishes the observed discontinuity from an explanation for it. Numeric findings are unchanged.
Six of the eight St. Louis-area districts with the highest chronic absenteeism rates improved between 2021-22 and 2024-25. The progress did not erase a sharp local divide: all eight still reported rates from 39.6% to 57.1% in 2024-25.
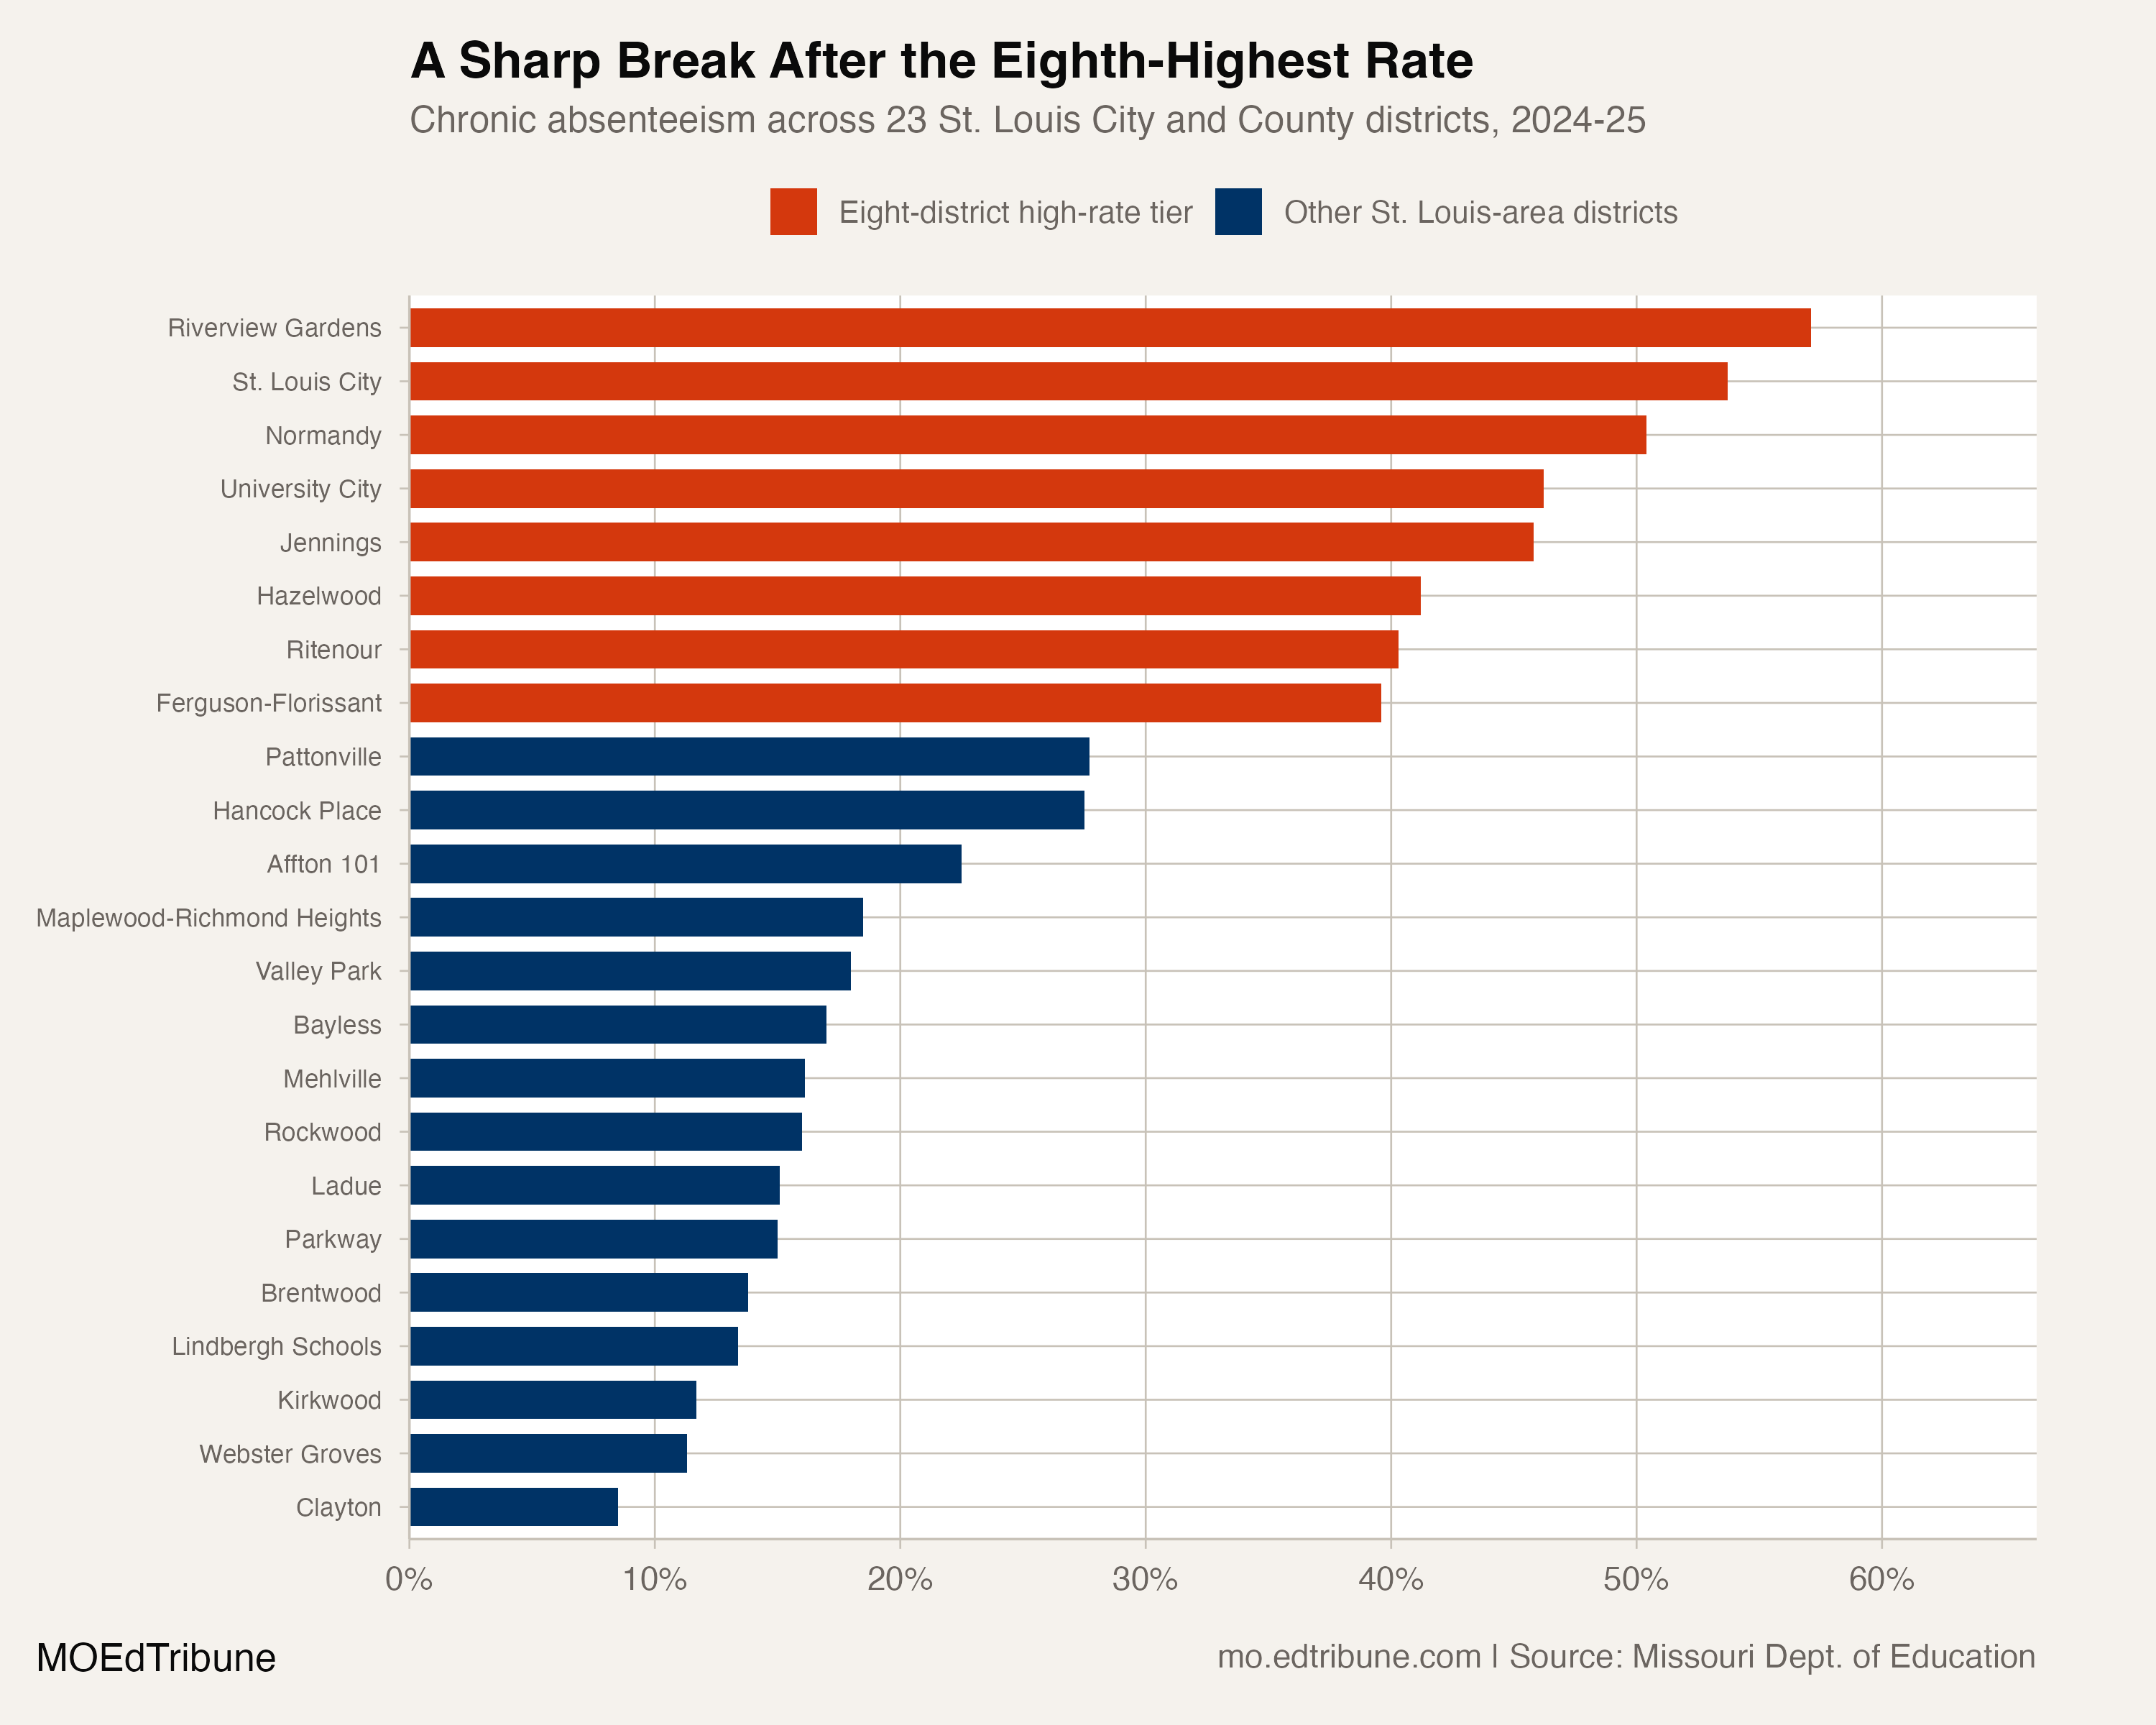
Riverview Gardens↗ET had the highest rate at 57.1%, followed by St. Louis City↗ET at 53.7% and Normandy Schools Collaborative↗ET at 50.4%. The next five systems were University City↗ET, Jennings↗ET, Hazelwood↗ET, Ritenour↗ET and Ferguson-Florissant↗ET.
Those eight were not merely the top of a smooth ranking. Among the 23 districts assigned to St. Louis or St. Louis City counties in the state directory, Ferguson-Florissant ranked eighth at 39.6%. Pattonville ranked ninth at 27.7%, leaving an 11.9-point break between the two groups.
One local tier, not a metro average
The comparison uses the directory's county field to define the local universe and six-digit district IDs to follow the same systems over time. All 23 IDs have a record in every year of the state's available 2008-09 through 2024-25 chronic-absence series. Complete row coverage, however, does not make every annual transition comparable.
Missouri's statewide chronic absenteeism rate was 21.5% in 2024-25. The lowest rate in the eight-district tier was 1.8 times that statewide figure.
That comparison should not be read as a student-weighted average for the St. Louis area. The district-level attendance records used here provide rates but not the student denominators needed to combine them. Ranking the 23 district rates answers a narrower question: how the systems compare with one another.
Improvement from the 2021-22 endpoint
Six districts in the high-rate tier had lower rates in 2024-25 than in 2021-22. Ferguson-Florissant fell from 48.3% to 39.6%, an 8.7-point improvement. Riverview Gardens fell from 65.3% to 57.1%, an 8.2-point improvement.
Four other rates also declined: Normandy from 57.0% to 50.4%, University City from 49.4% to 46.2%, Jennings from 48.0% to 45.8% and Ritenour from 42.5% to 40.3%.
St. Louis City was unchanged at 53.7%. Hazelwood moved from 41.0% to 41.2%, a 0.2-point increase.
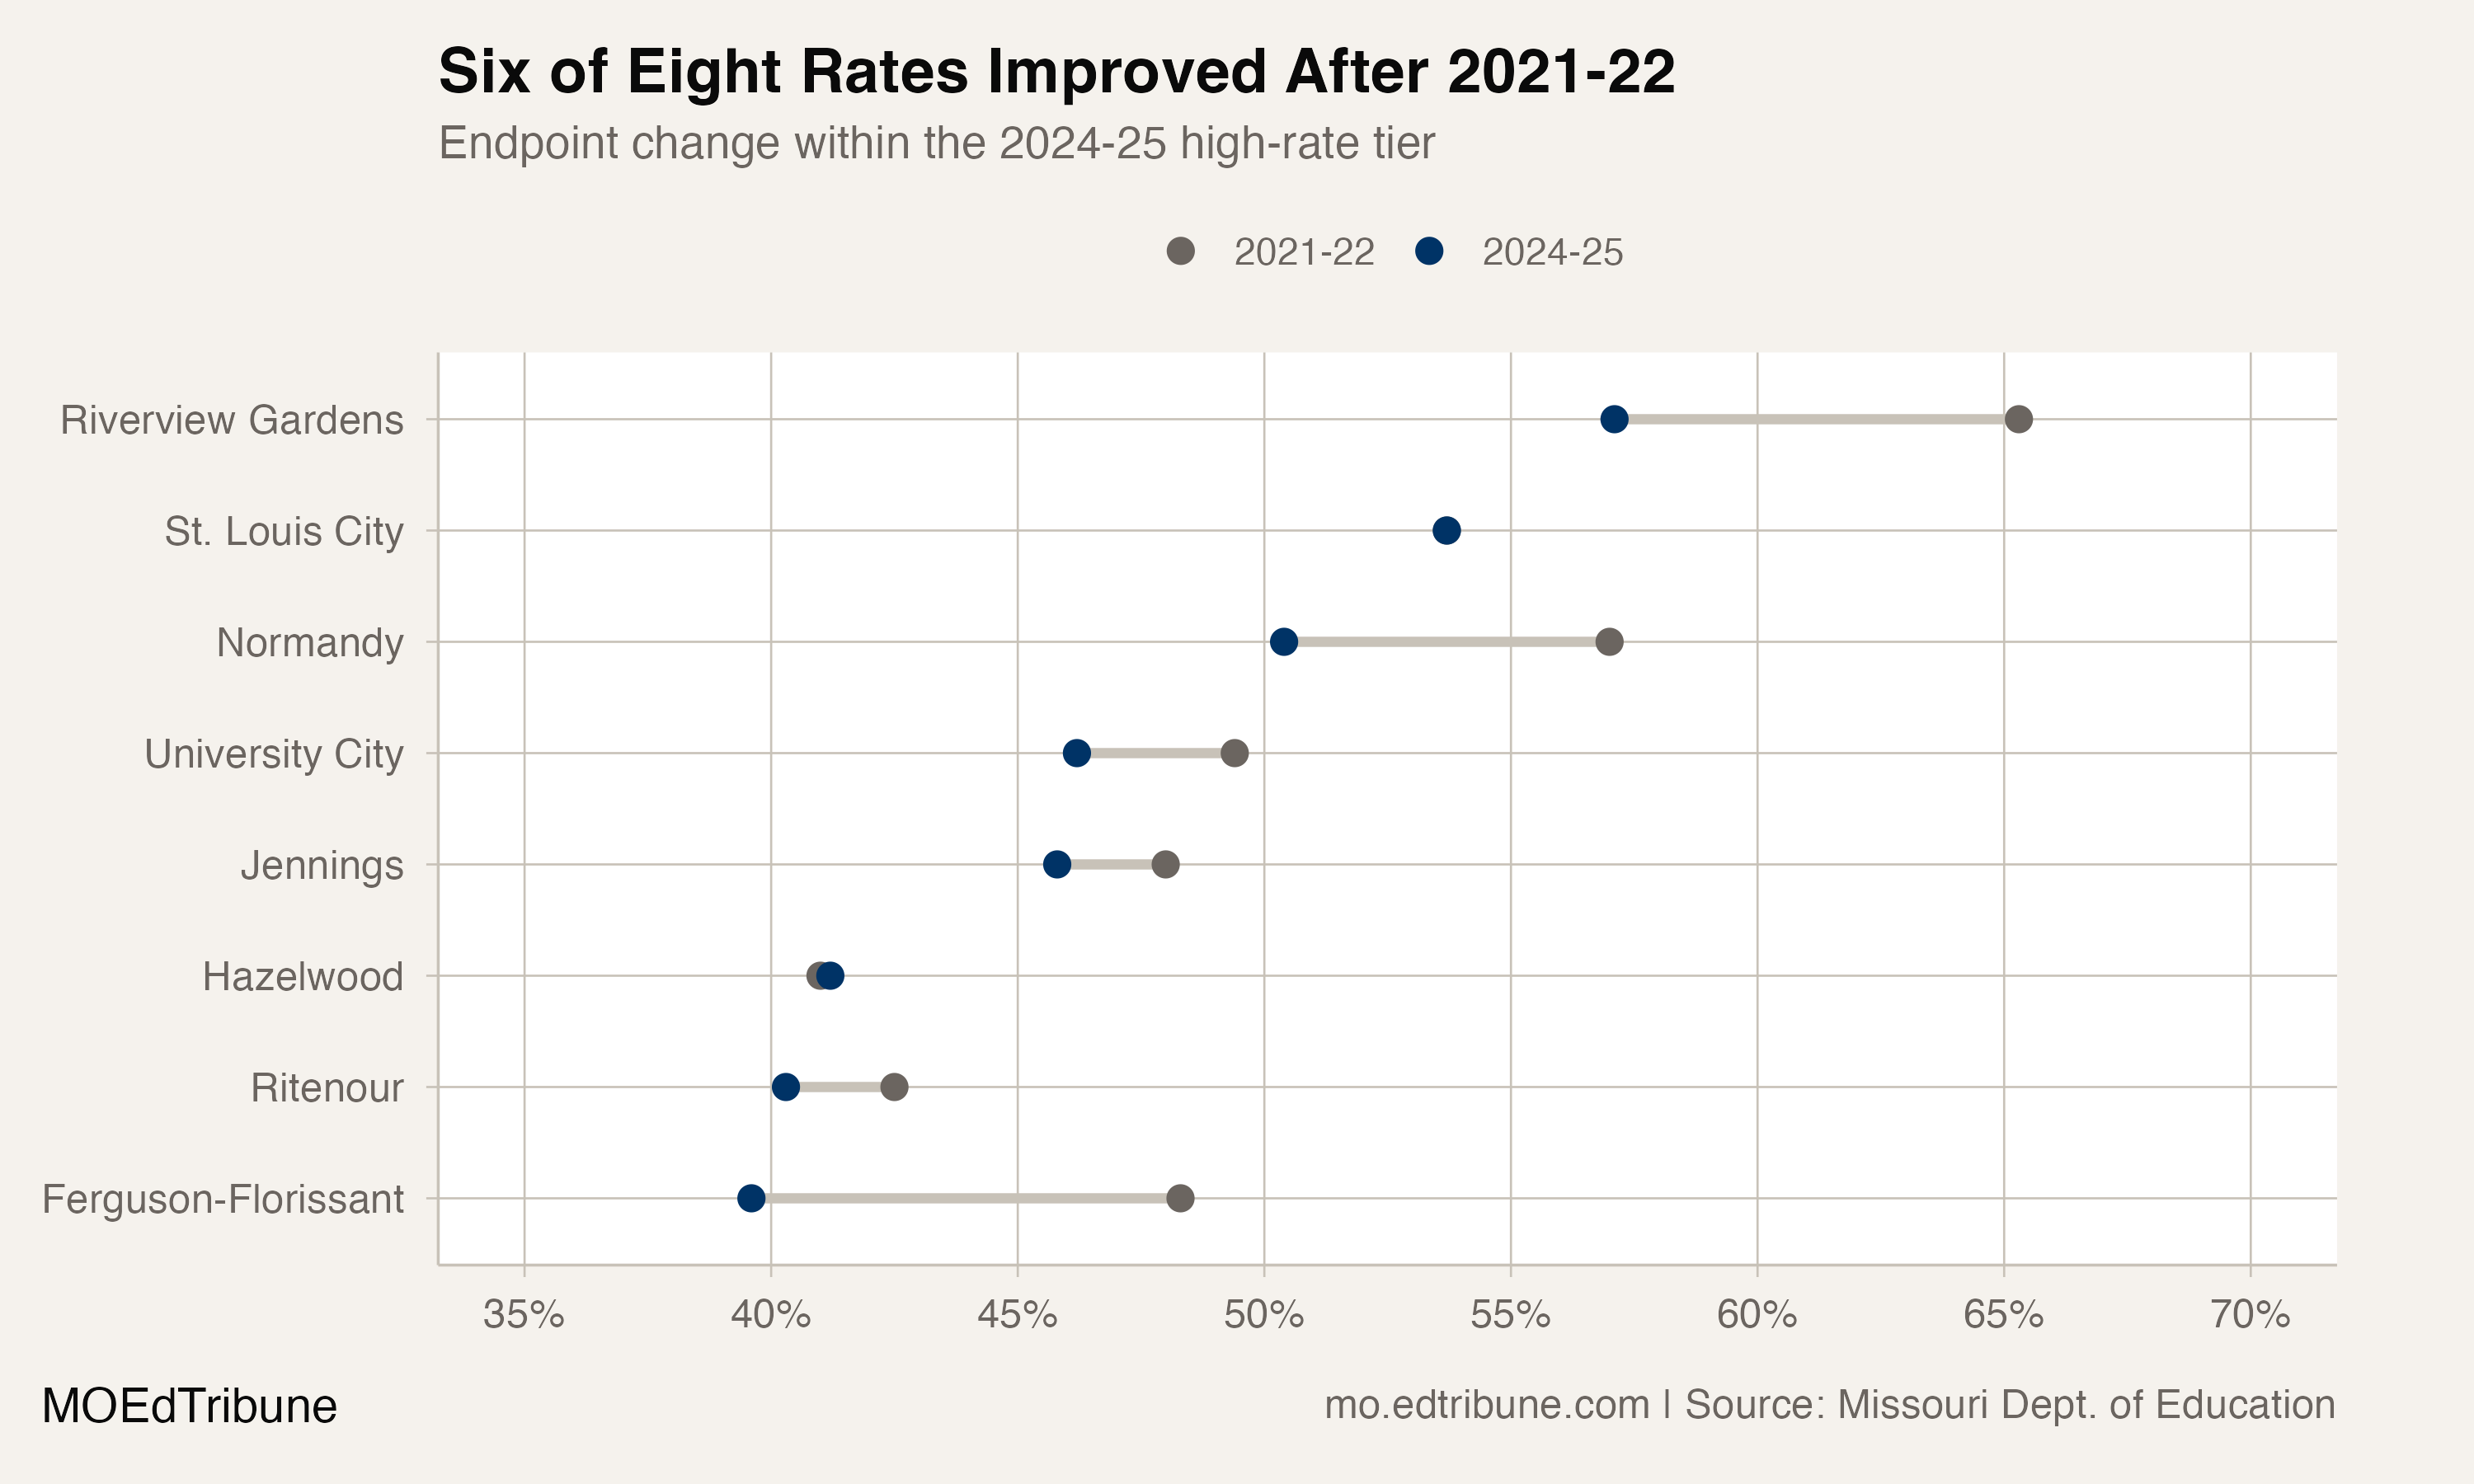
The endpoint comparison is evidence of partial improvement, not a claim that the recovery was steady each year. It also does not make 2021-22 a universal peak. The full series is retained in the analysis so that the selected endpoints do not substitute for each district's complete path.
A discontinuity around 2020-21
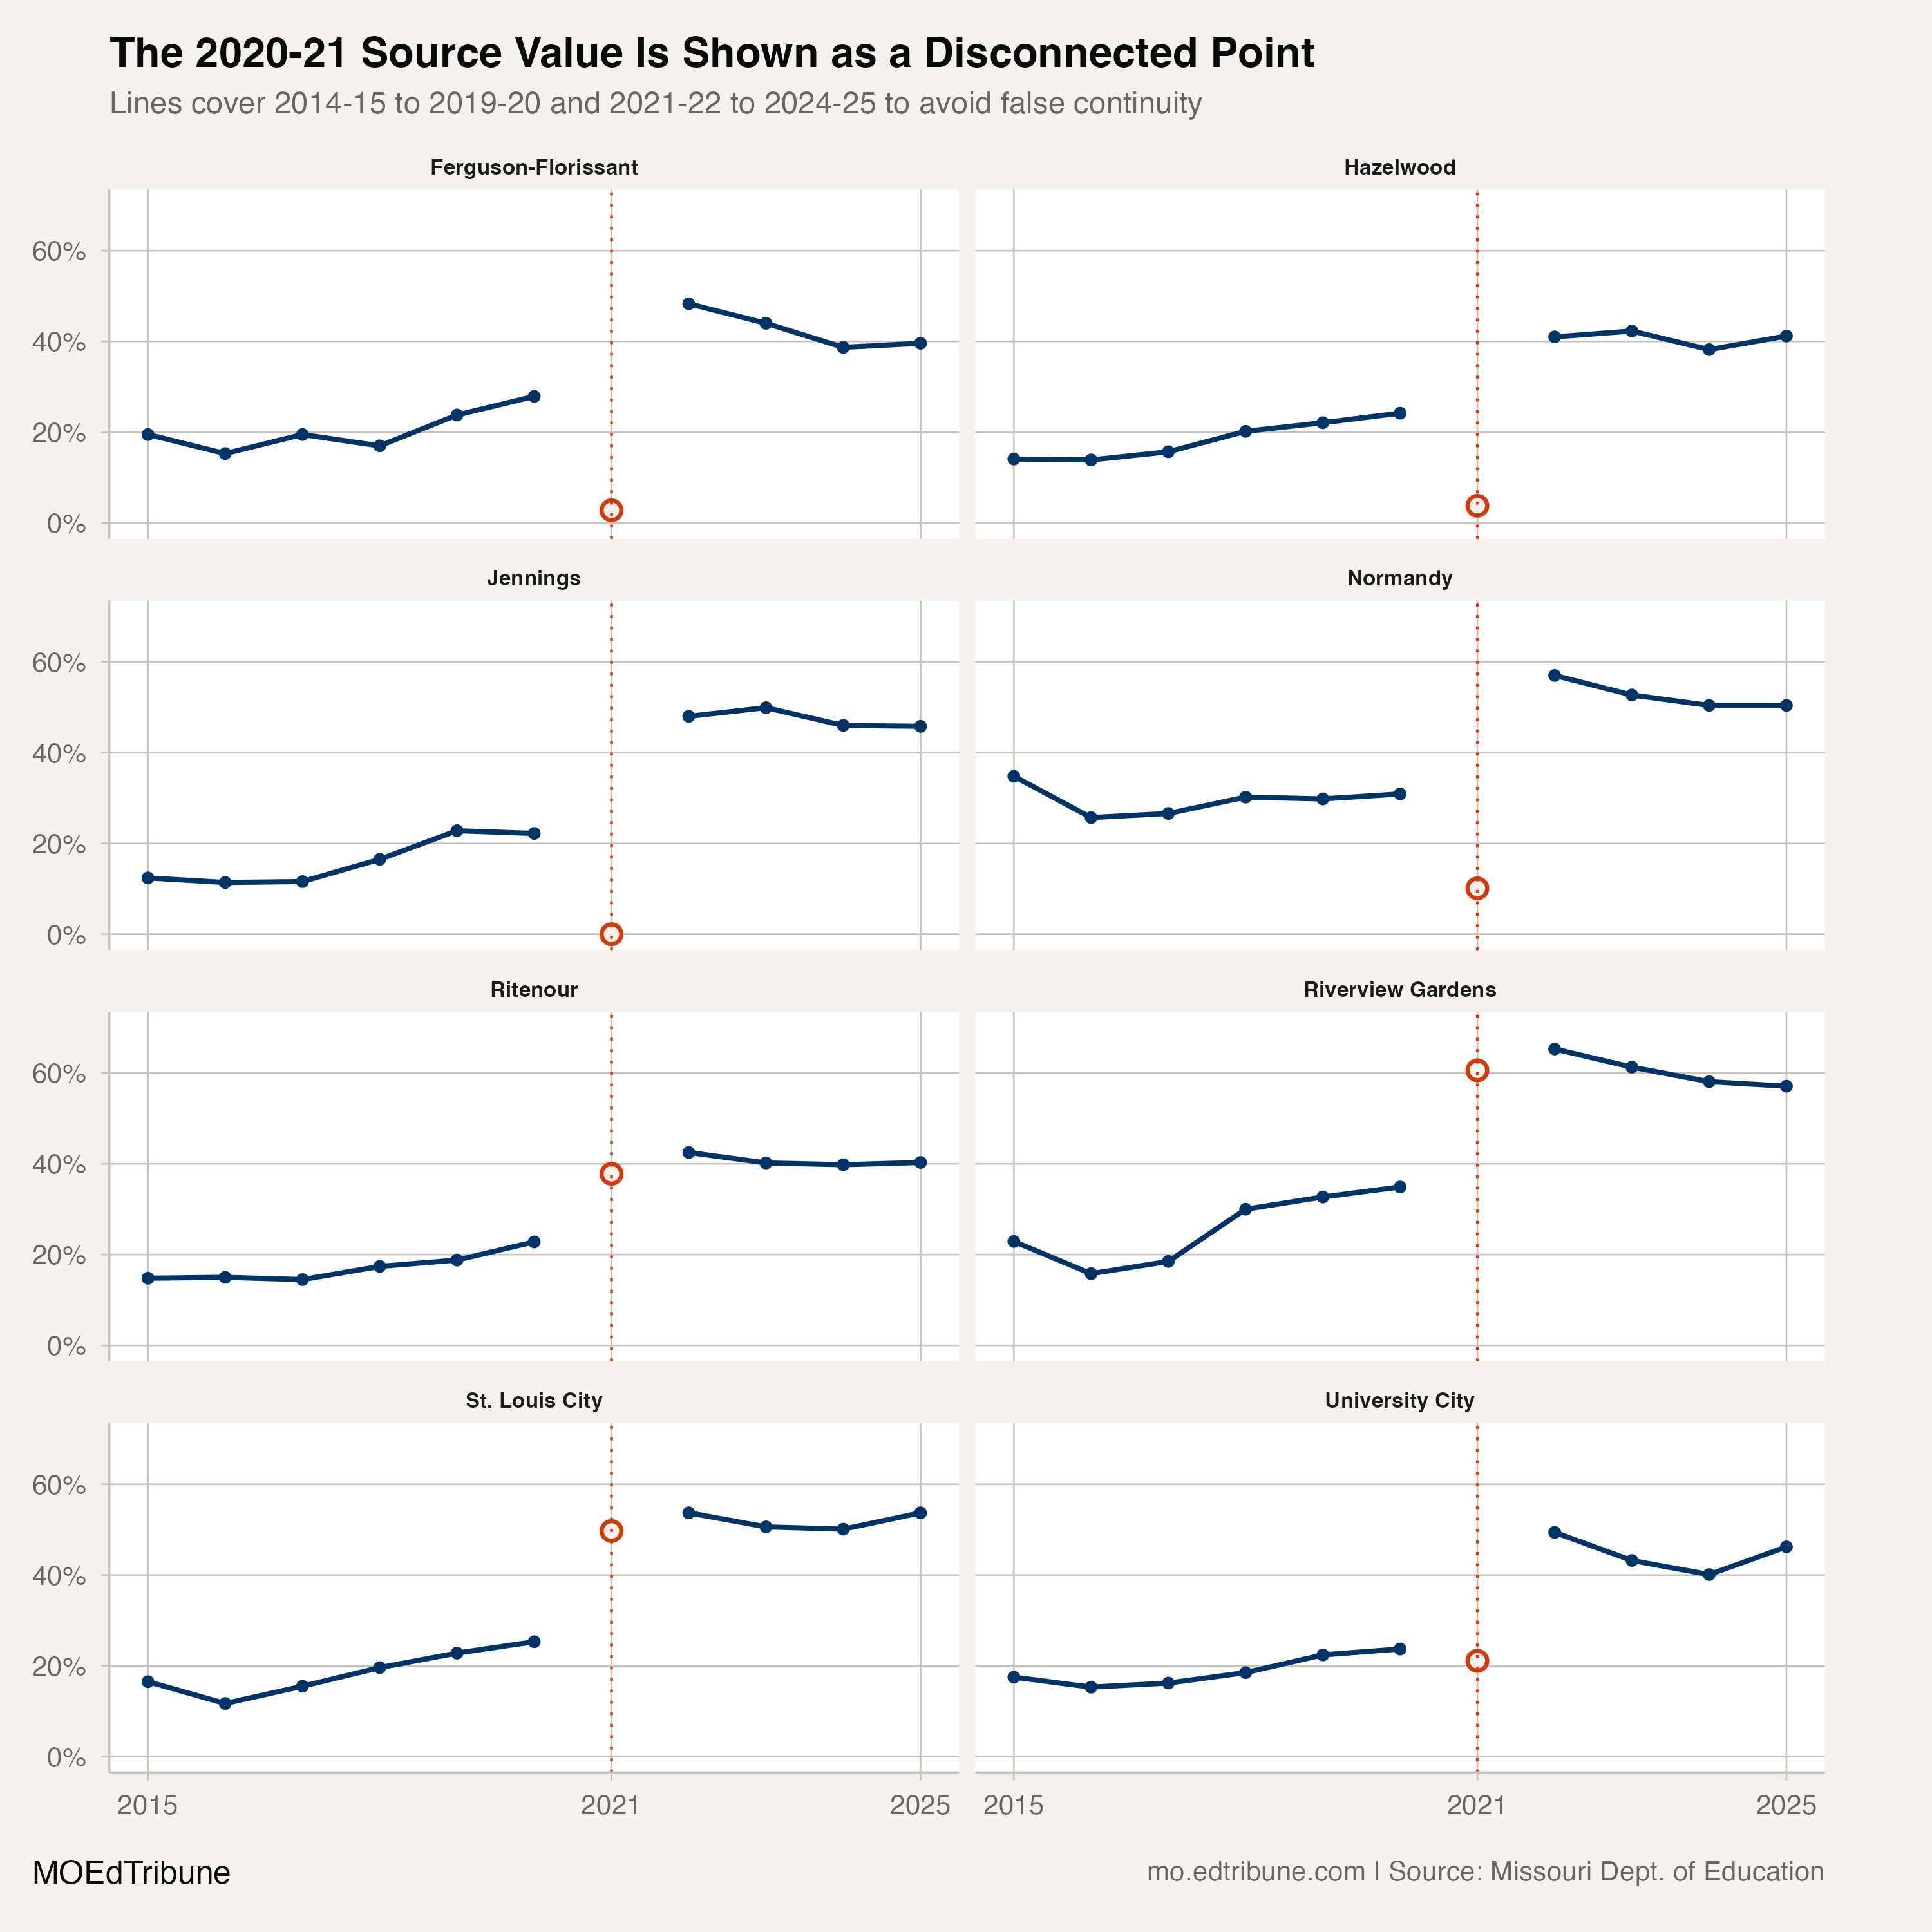
A coded annual-jump screen found changes greater than 10 percentage points for 11 of the 23 local districts entering 2020-21 and seven entering 2021-22. Within the eight-district high-rate tier, seven had a change above that threshold entering 2020-21 and five did so entering 2021-22.
The statewide rate did not show the same break. Its largest absolute annual change across the available series was 6.1 points, entering 2021-22. The local pattern is therefore treated as a district-panel discontinuity, not as a normal continuous transition.
The records do not identify what produced the discontinuity. The comparisons used in this article avoid treating 2020-21 as a baseline: the longer view compares 2014-15 with 2024-25, while the improvement check compares 2021-22 with 2024-25.
A longer gap from 2014-15
Every district in the high-rate tier remained above its own 2014-15 rate in 2024-25. Seven of the eight had at least doubled. Normandy was the exception, rising from 34.8% to 50.4%.
The reported chronic-absence rate is the complement of Missouri’s published proportional attendance rate: every observed district-year rate equals 100 minus that attendance rate. This arithmetic does not independently establish an operational attendance threshold or resolve the discontinuity around 2020-21.
These attendance and directory records do not identify why the eight districts form a separated high-rate tier. They cannot establish explanations involving student demographics, household income, housing, transportation, district leadership, health or other community conditions. Those questions require evidence beyond the pattern reported here.
The observed result is narrower but still consequential: six systems improved after 2021-22, yet an 11.9-point break continued to separate the eighth- and ninth-ranked St. Louis-area districts in 2024-25.
Detailed code that reproduces the analysis and figures in this article is available exclusively to EdTribune subscribers.
Discussion
Sign in to join the discussion.
Loading comments...