Correction (September 19, 2026): An earlier version of this article said nine of Missouri's 560 districts had chronic absenteeism at or above 50% in 2024-25. The state attendance file it used carried corrupted rates for several St. Louis charter schools and recorded years when a school was not yet operating as if it had a rate. On the corrected file, 11 of the 557 districts with a reported rate were at or above 50%: Kairos Academies and KIPP St. Louis Public Schools join the list. The earlier version also said The Biome's rate was 100.0% at the start of the panel; The Biome had no published rate that year, and its first, in 2015-16, was 23.3%. The tier counts below are recomputed. The earlier headline described these districts as having more students absent than present; the measure counts students who missed at least 10% of their enrolled days, not daily attendance, and the headline now says so.
Eleven of Missouri's 557 districts with a reported rate had chronic absenteeism at or above 50% in 2024-25. In those districts, at least half of the students met the state's chronic-absence threshold.
Kairos Academies led the list at 70.1%, followed by Hogan Preparatory Academy at 69.9%. KIPP: Endeavor Academy was at 60.5%, The Biome at 59.1%, Riverview Gardens at 57.1%, KIPP St. Louis Public Schools at 54.8%, St. Louis City↗ET at 53.7%, Kansas City↗ET at 51.1%, Missouri Schools for the Severely Disabled at 51.0%, Lee A. Tolbert Community Academy at 50.7%, and Normandy Schools Collaborative↗ET at 50.4%.
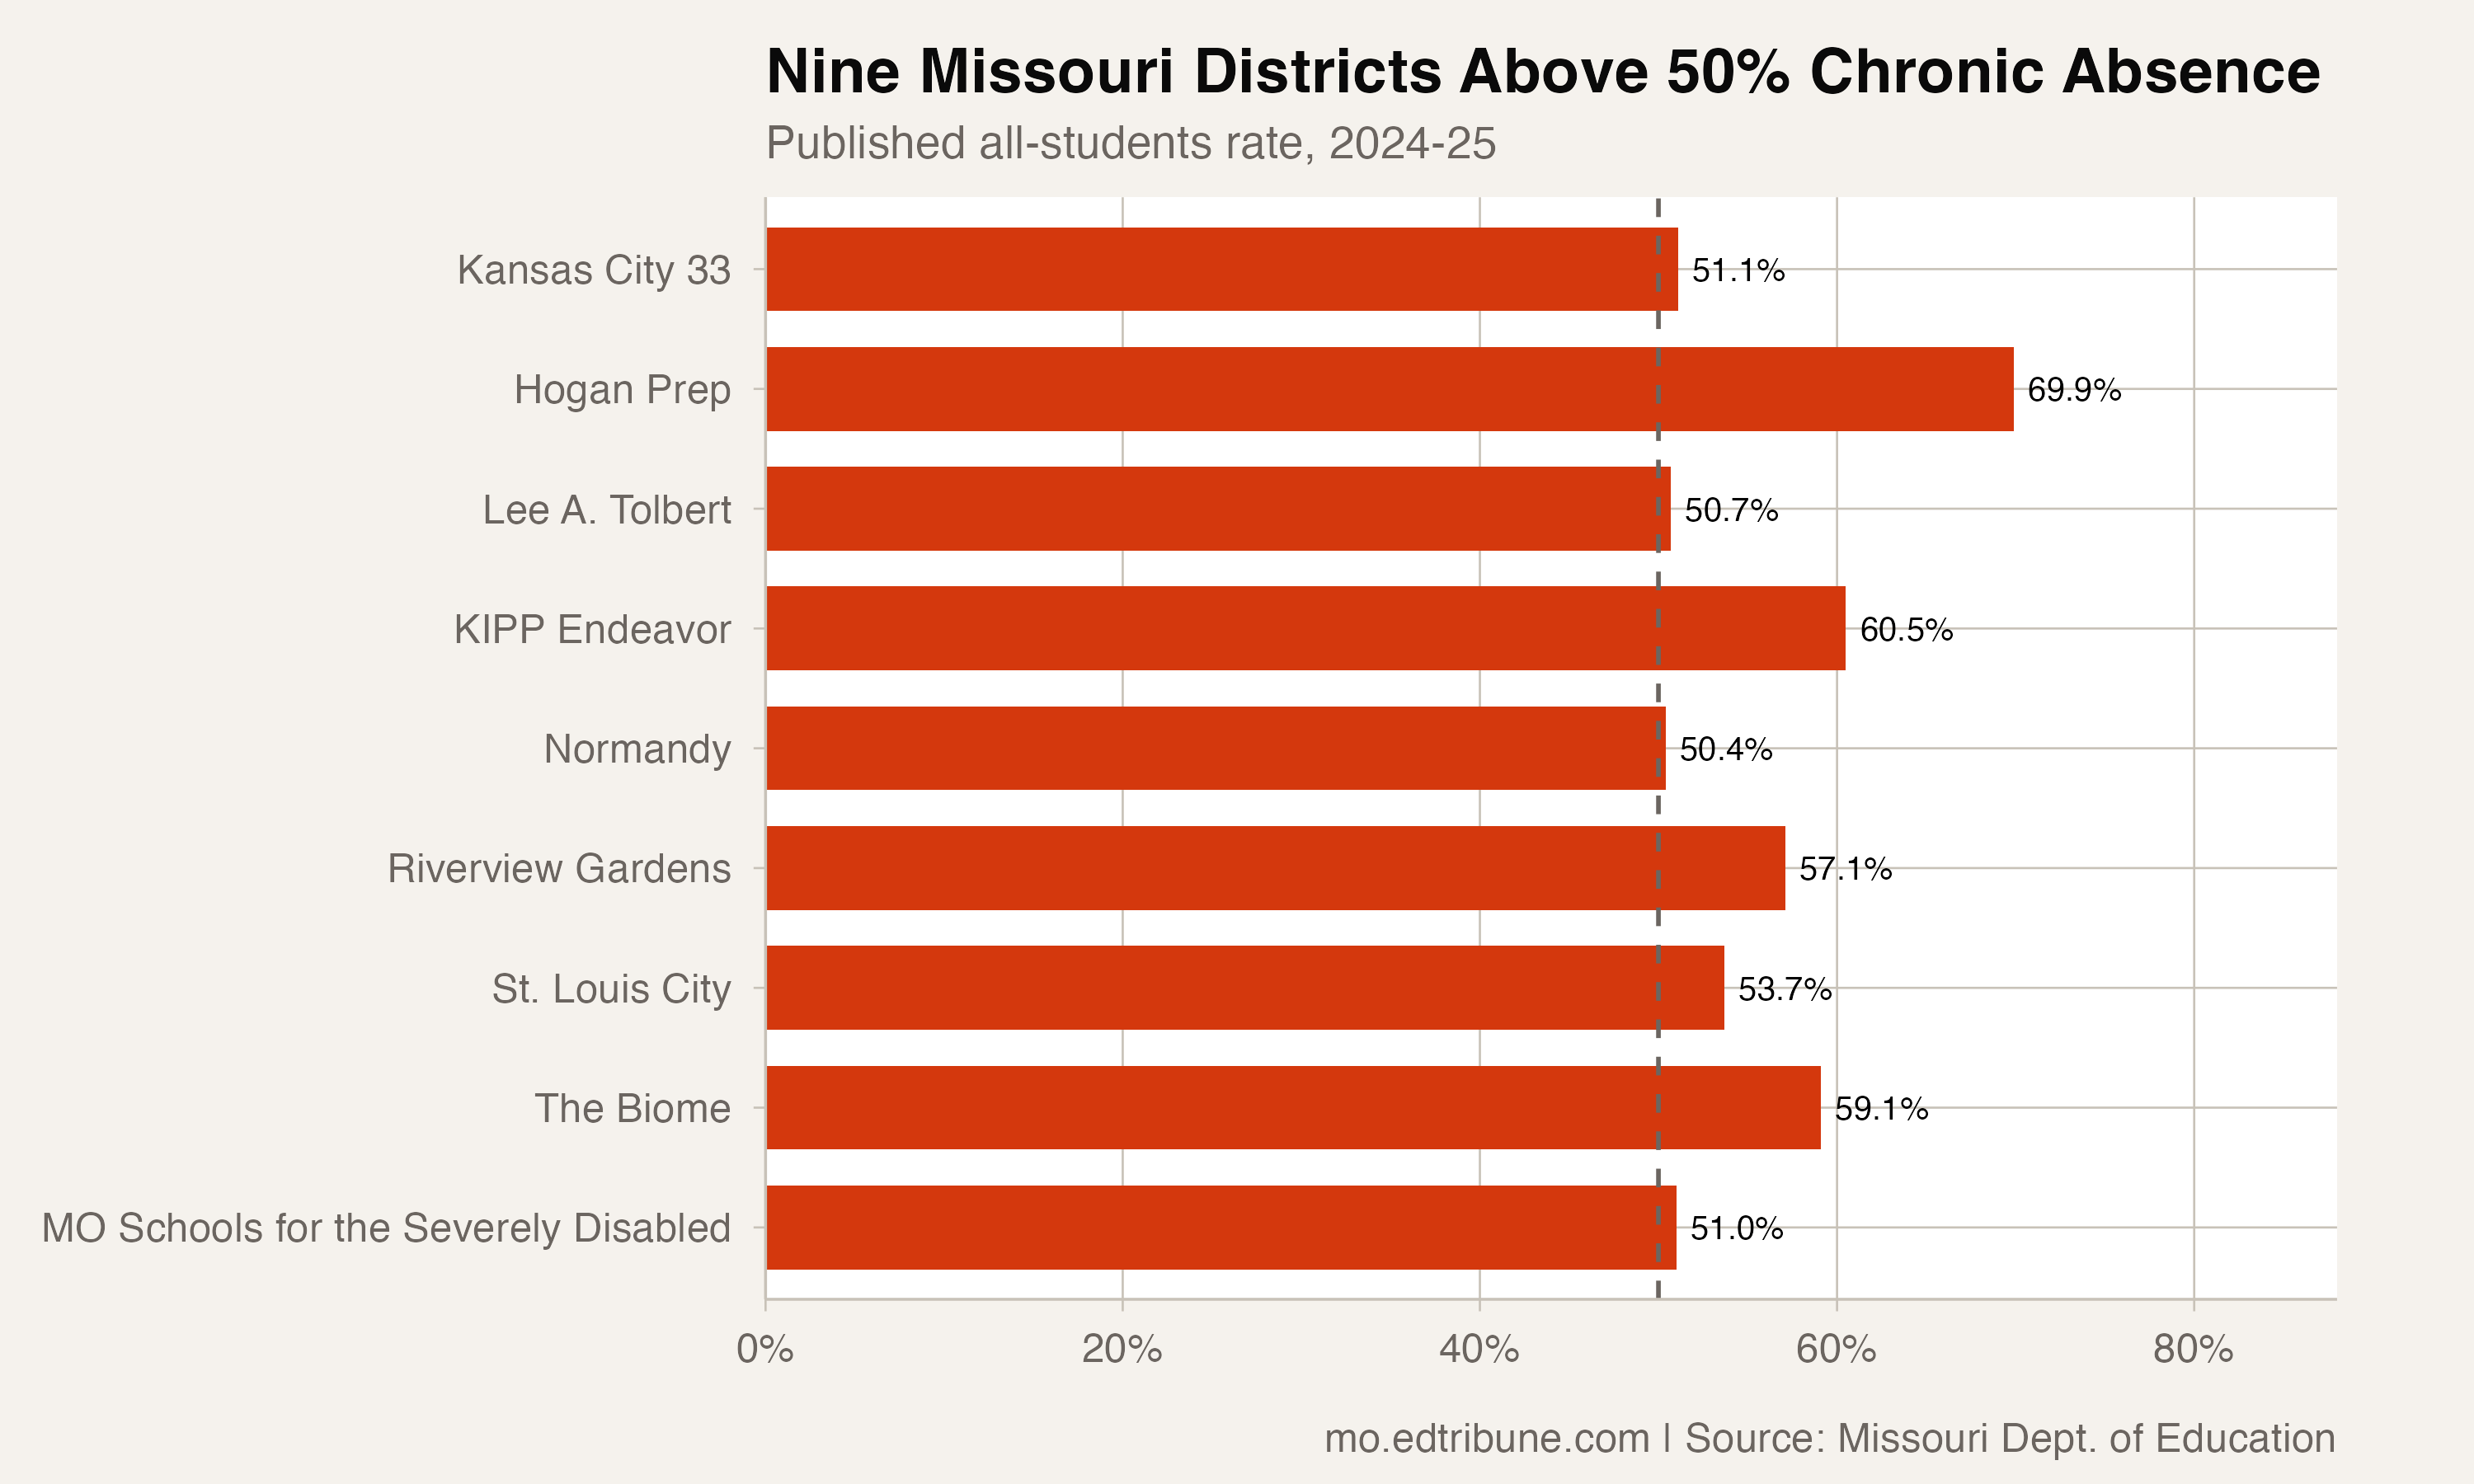
The latest high-rate list
The 50% line is a screening threshold, not an explanation. The attendance records show the size of the problem in each district; they do not identify one cause shared by all 11.
Hogan's trajectory shows how quickly a district can move across the line. Its chronic-absence rate was 14.0% in 2014-15 and 33.1% in 2019-20. It fell to 22.6% in 2020-21, then rose to 56.1% in 2021-22, 67.0% in 2022-23, and 73.4% in 2023-24 before easing to 69.9% in 2024-25.
The Biome followed a different path. Its first published rate was 23.3% in 2015-16. It fell to 2.6% in 2019-20 and reached 59.1% in 2024-25. The series records the changes; it does not establish why they occurred.
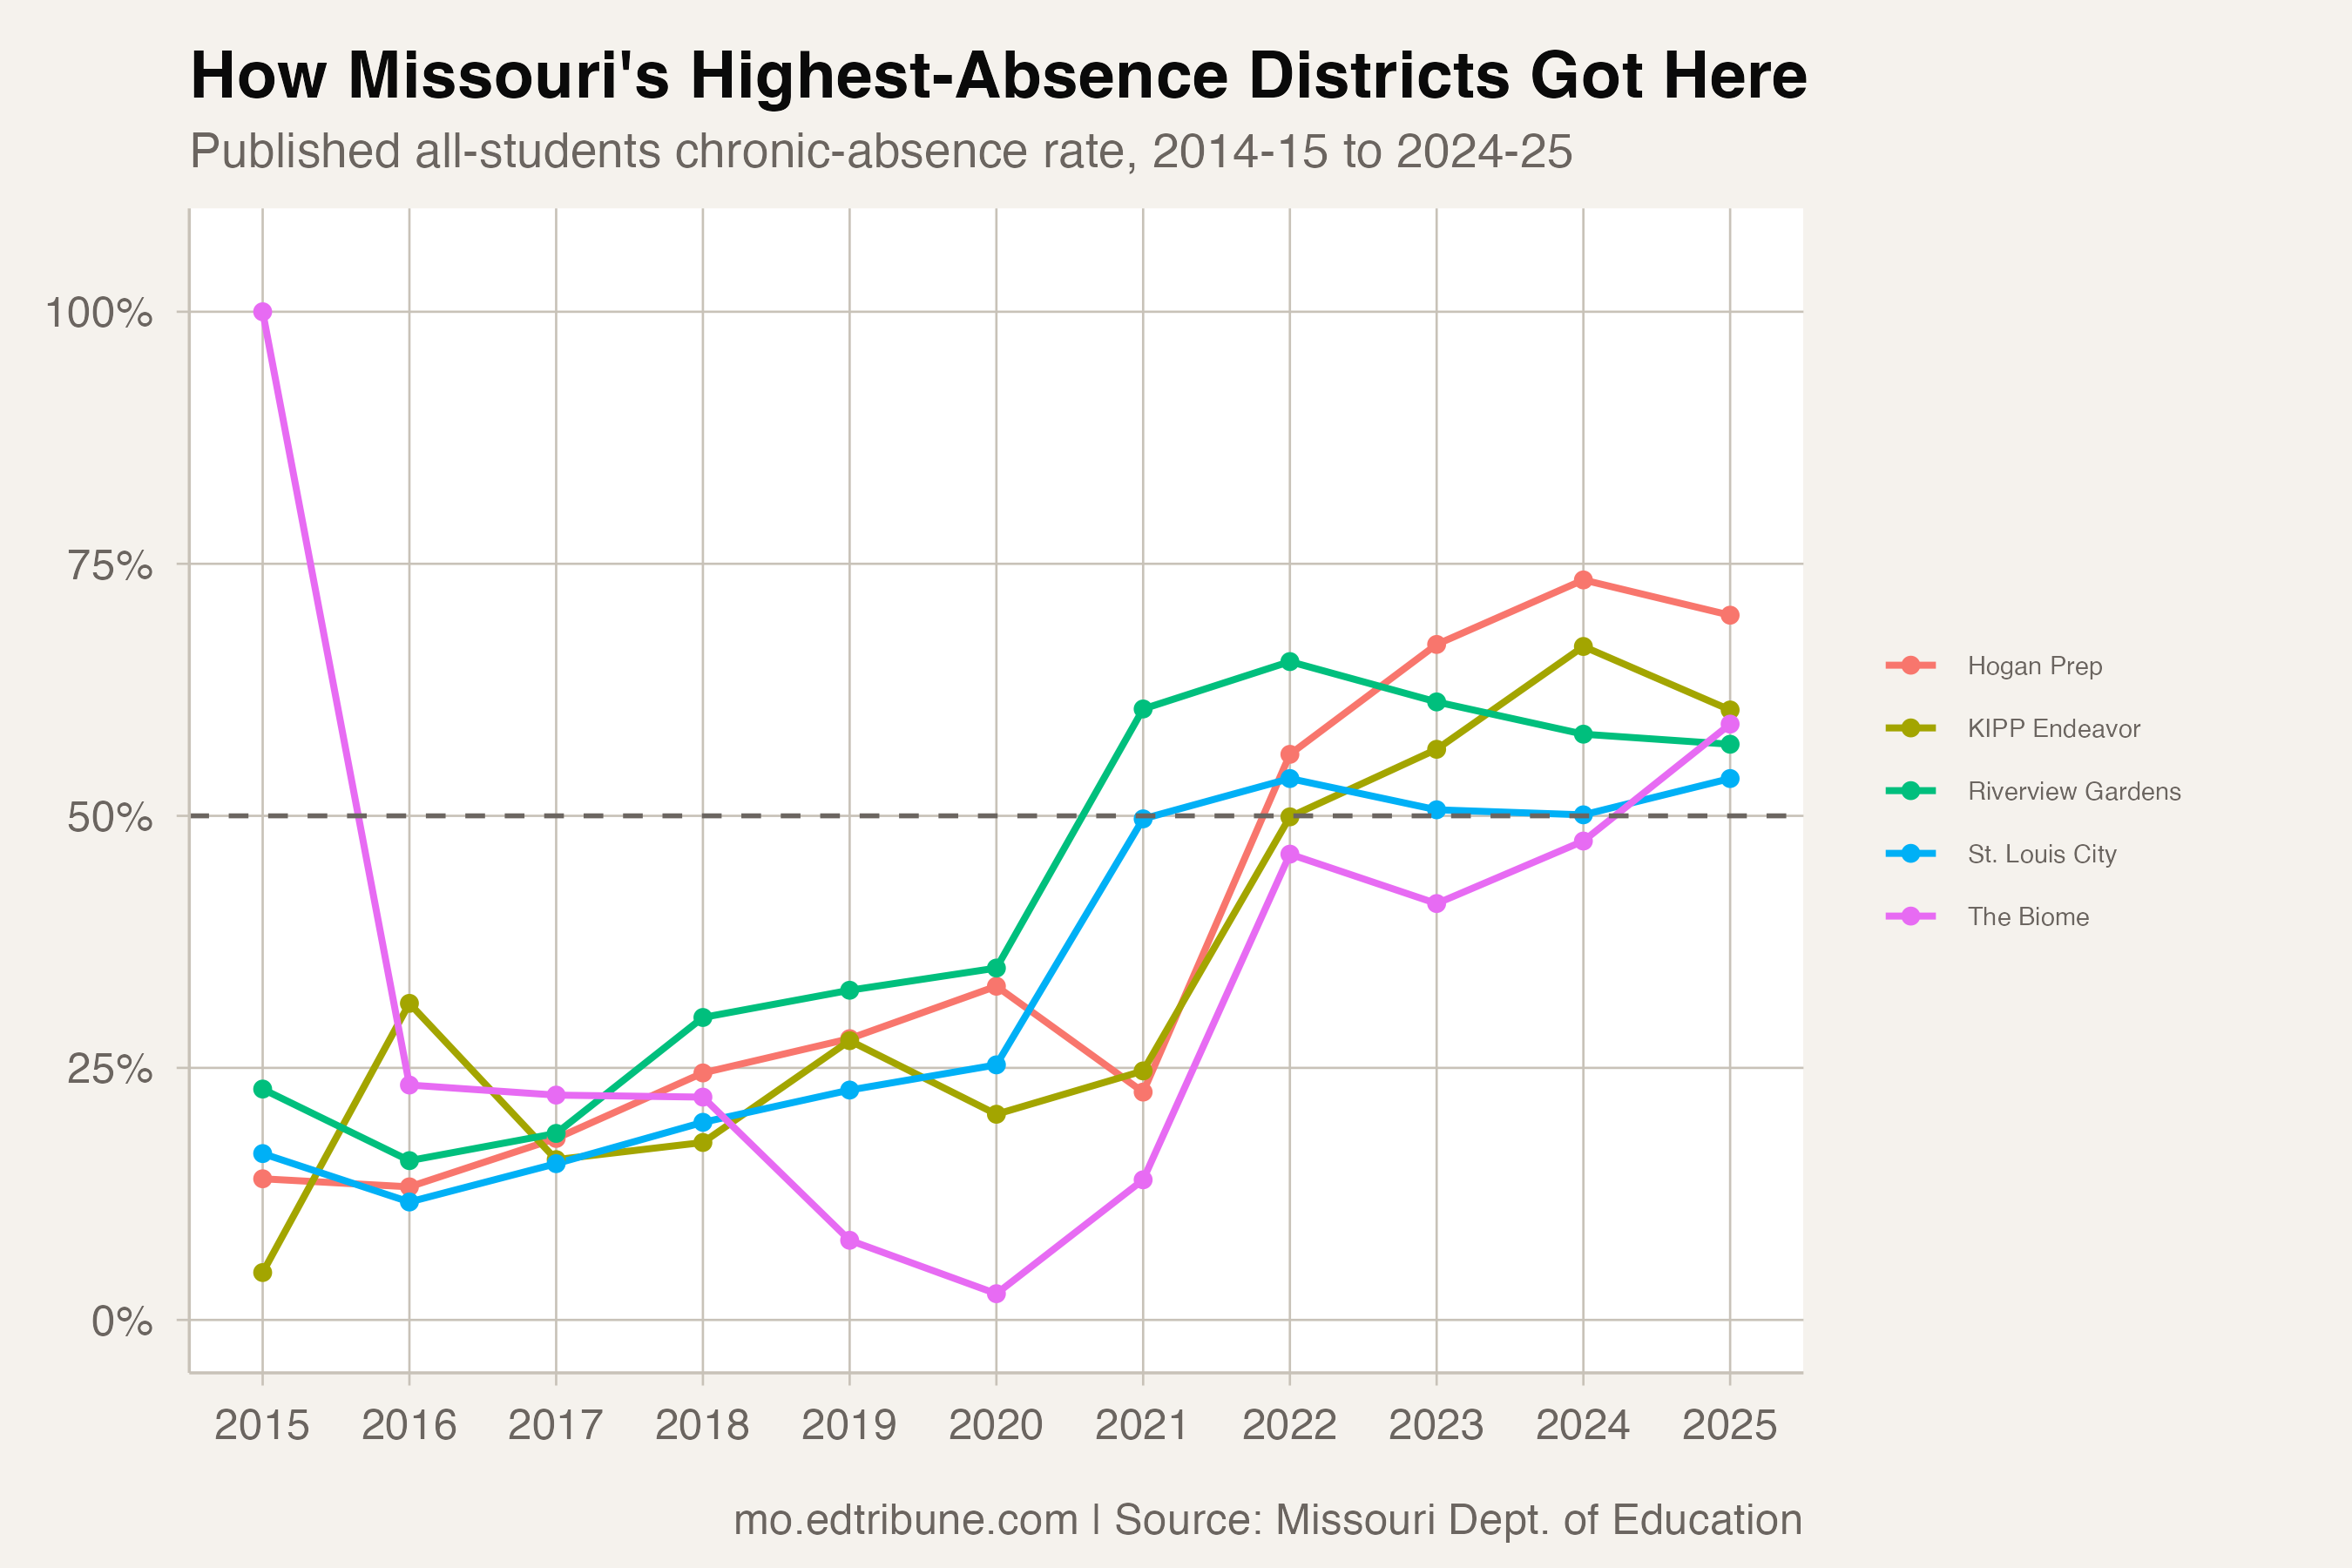
Riverview Gardens was already at 22.9% in 2014-15. Its rate rose to 65.3% in 2021-22 and stood at 57.1% in 2024-25, still above the screening line after the later decline.
Where the 50% line sits
The 557 districts with a reported rate in the 2024-25 file fall into six rate tiers:
| Tier | Number of districts |
|---|---|
| 0-10% | 111 |
| 10-20% | 288 |
| 20-30% | 106 |
| 30-40% | 20 |
| 40-50% | 21 |
| 50%+ | 11 |
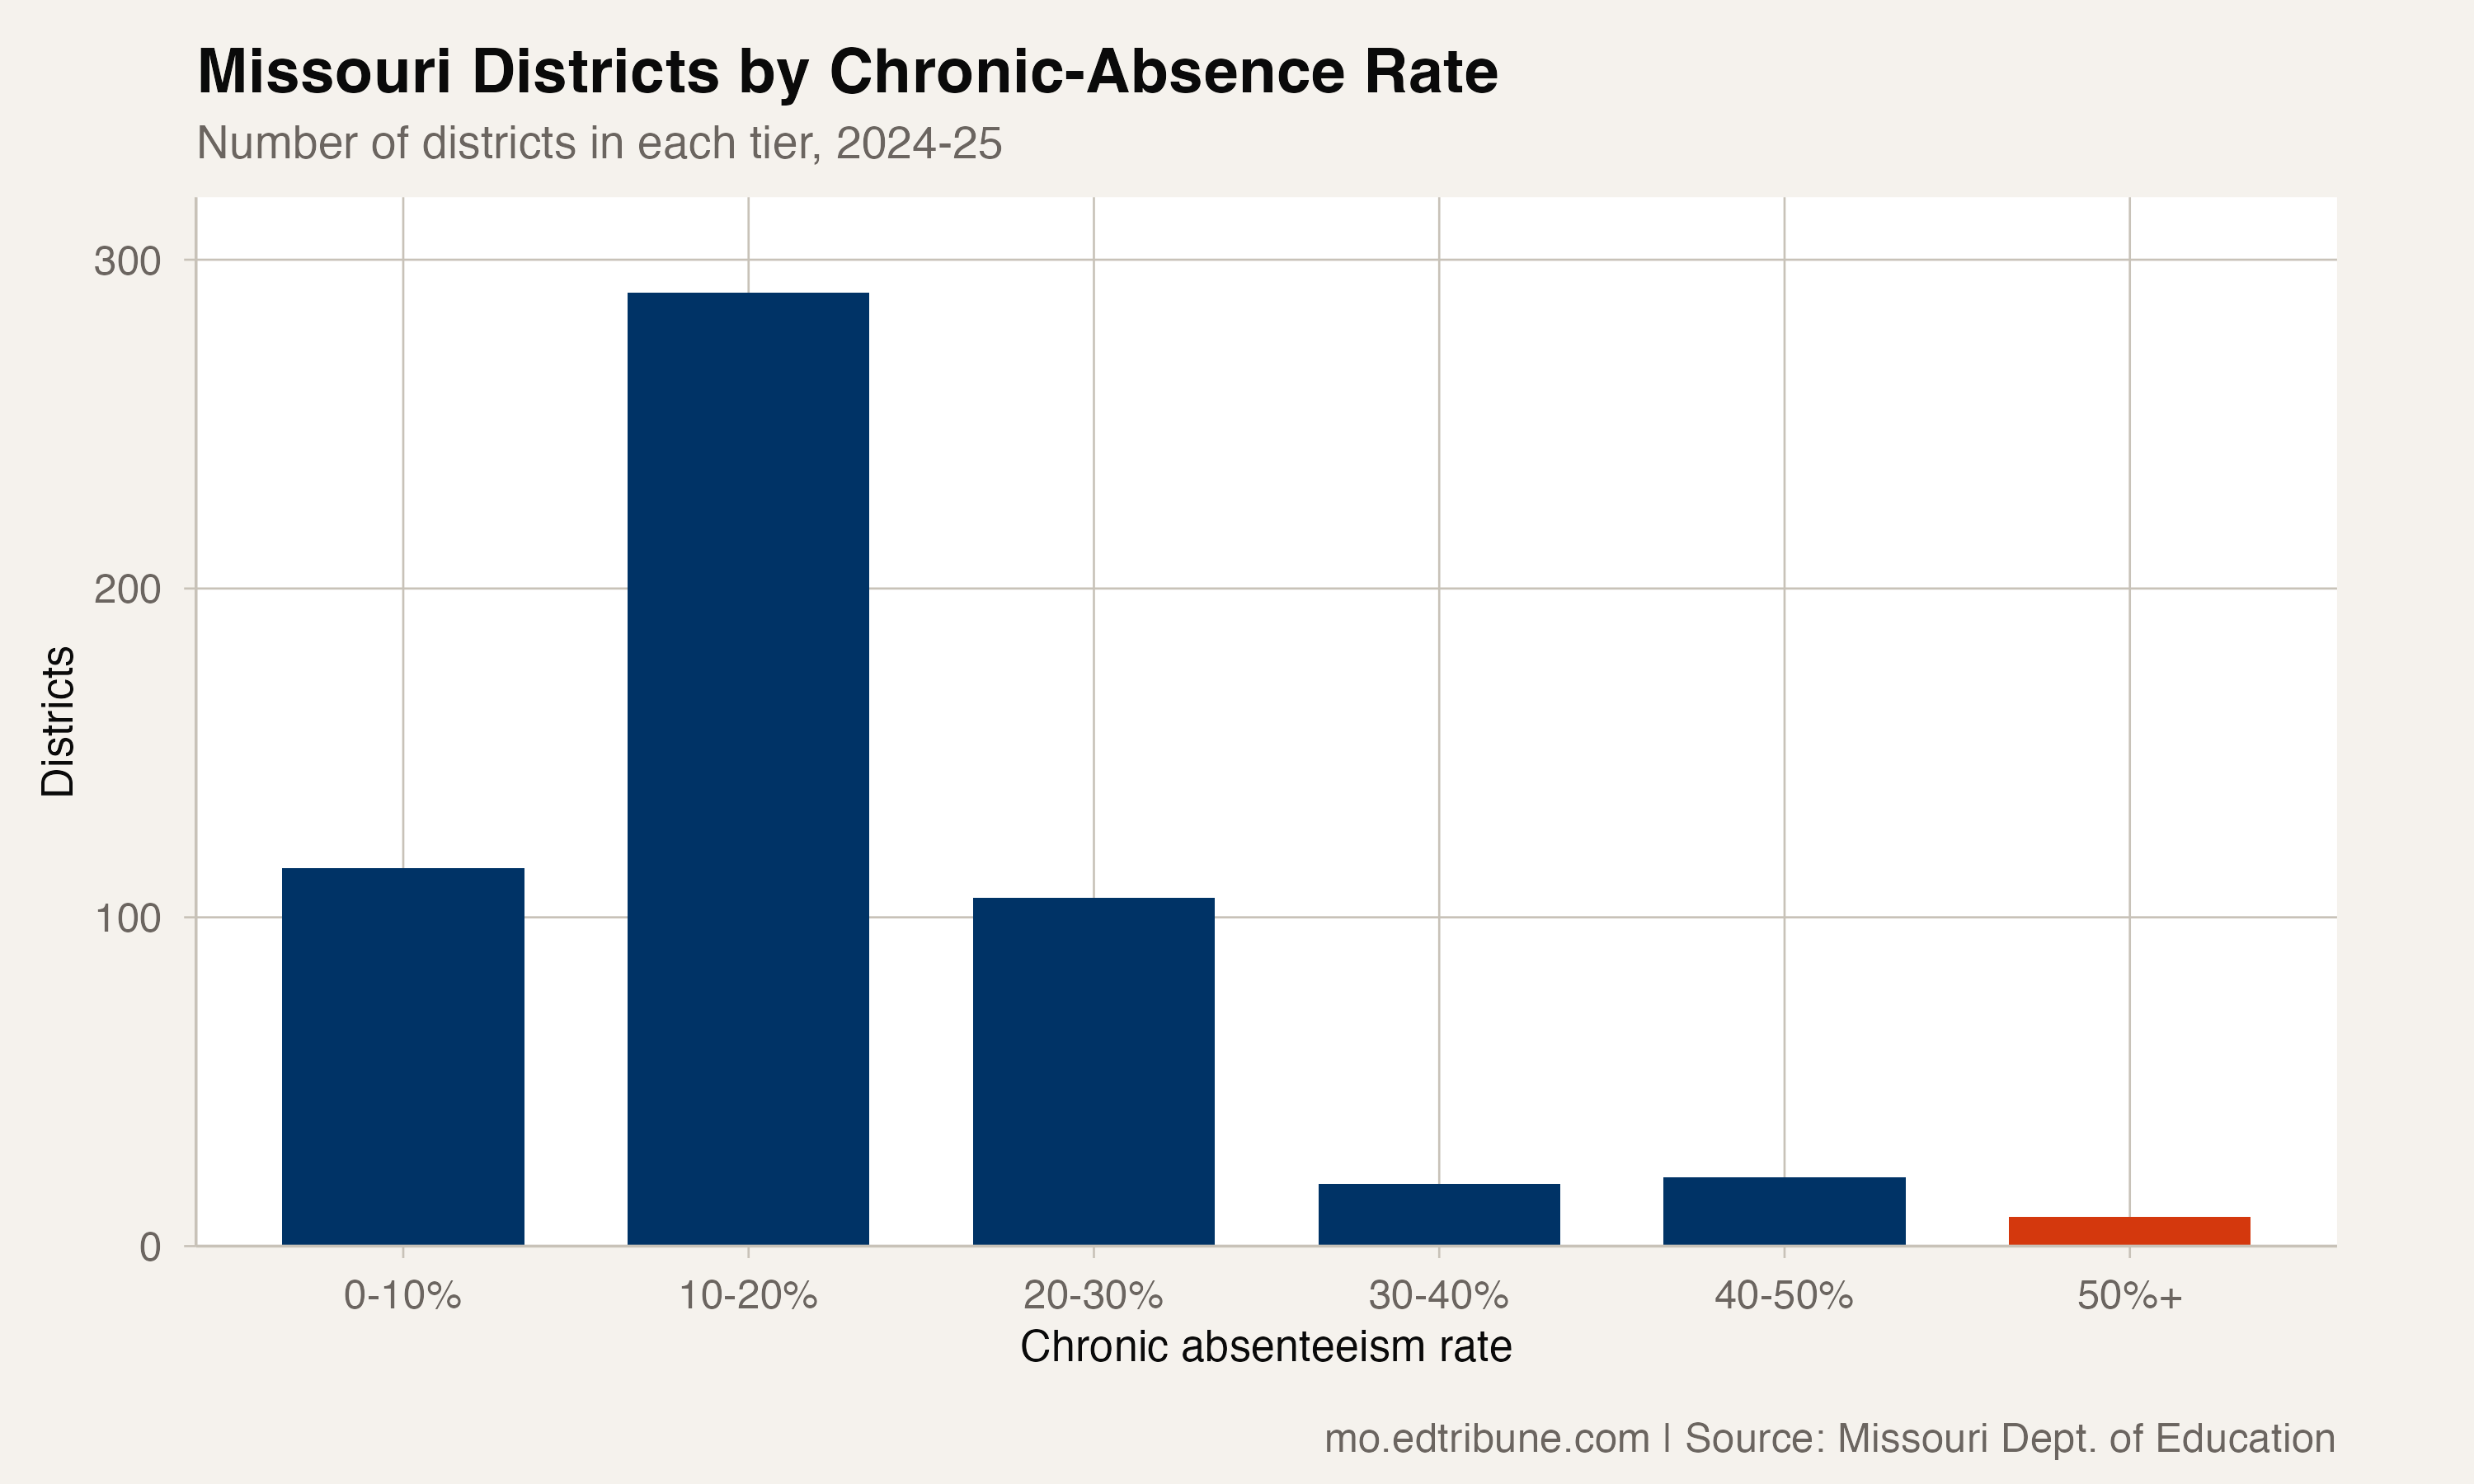
The highest-rate list is not a ranking of school quality or a diagnosis of any community. It is a snapshot of published chronic-absence rates, with the latest values sitting on top of a longer and uneven record.
Missouri Schools for the Severely Disabled is one example of that variation. Its published rate ranged from 39.1% to 80.5% between 2014-15 and 2024-25 and was 51.0% in 2024-25. That spread is a reason to read the current value alongside the history rather than treat the threshold as a complete explanation.
Attendance data come from the Missouri Department of Elementary and Secondary Education's Missouri Comprehensive Data System.
Detailed code that reproduces the analysis and figures in this article is available exclusively to EdTribune subscribers.
Discussion
Sign in to join the discussion.
Loading comments...