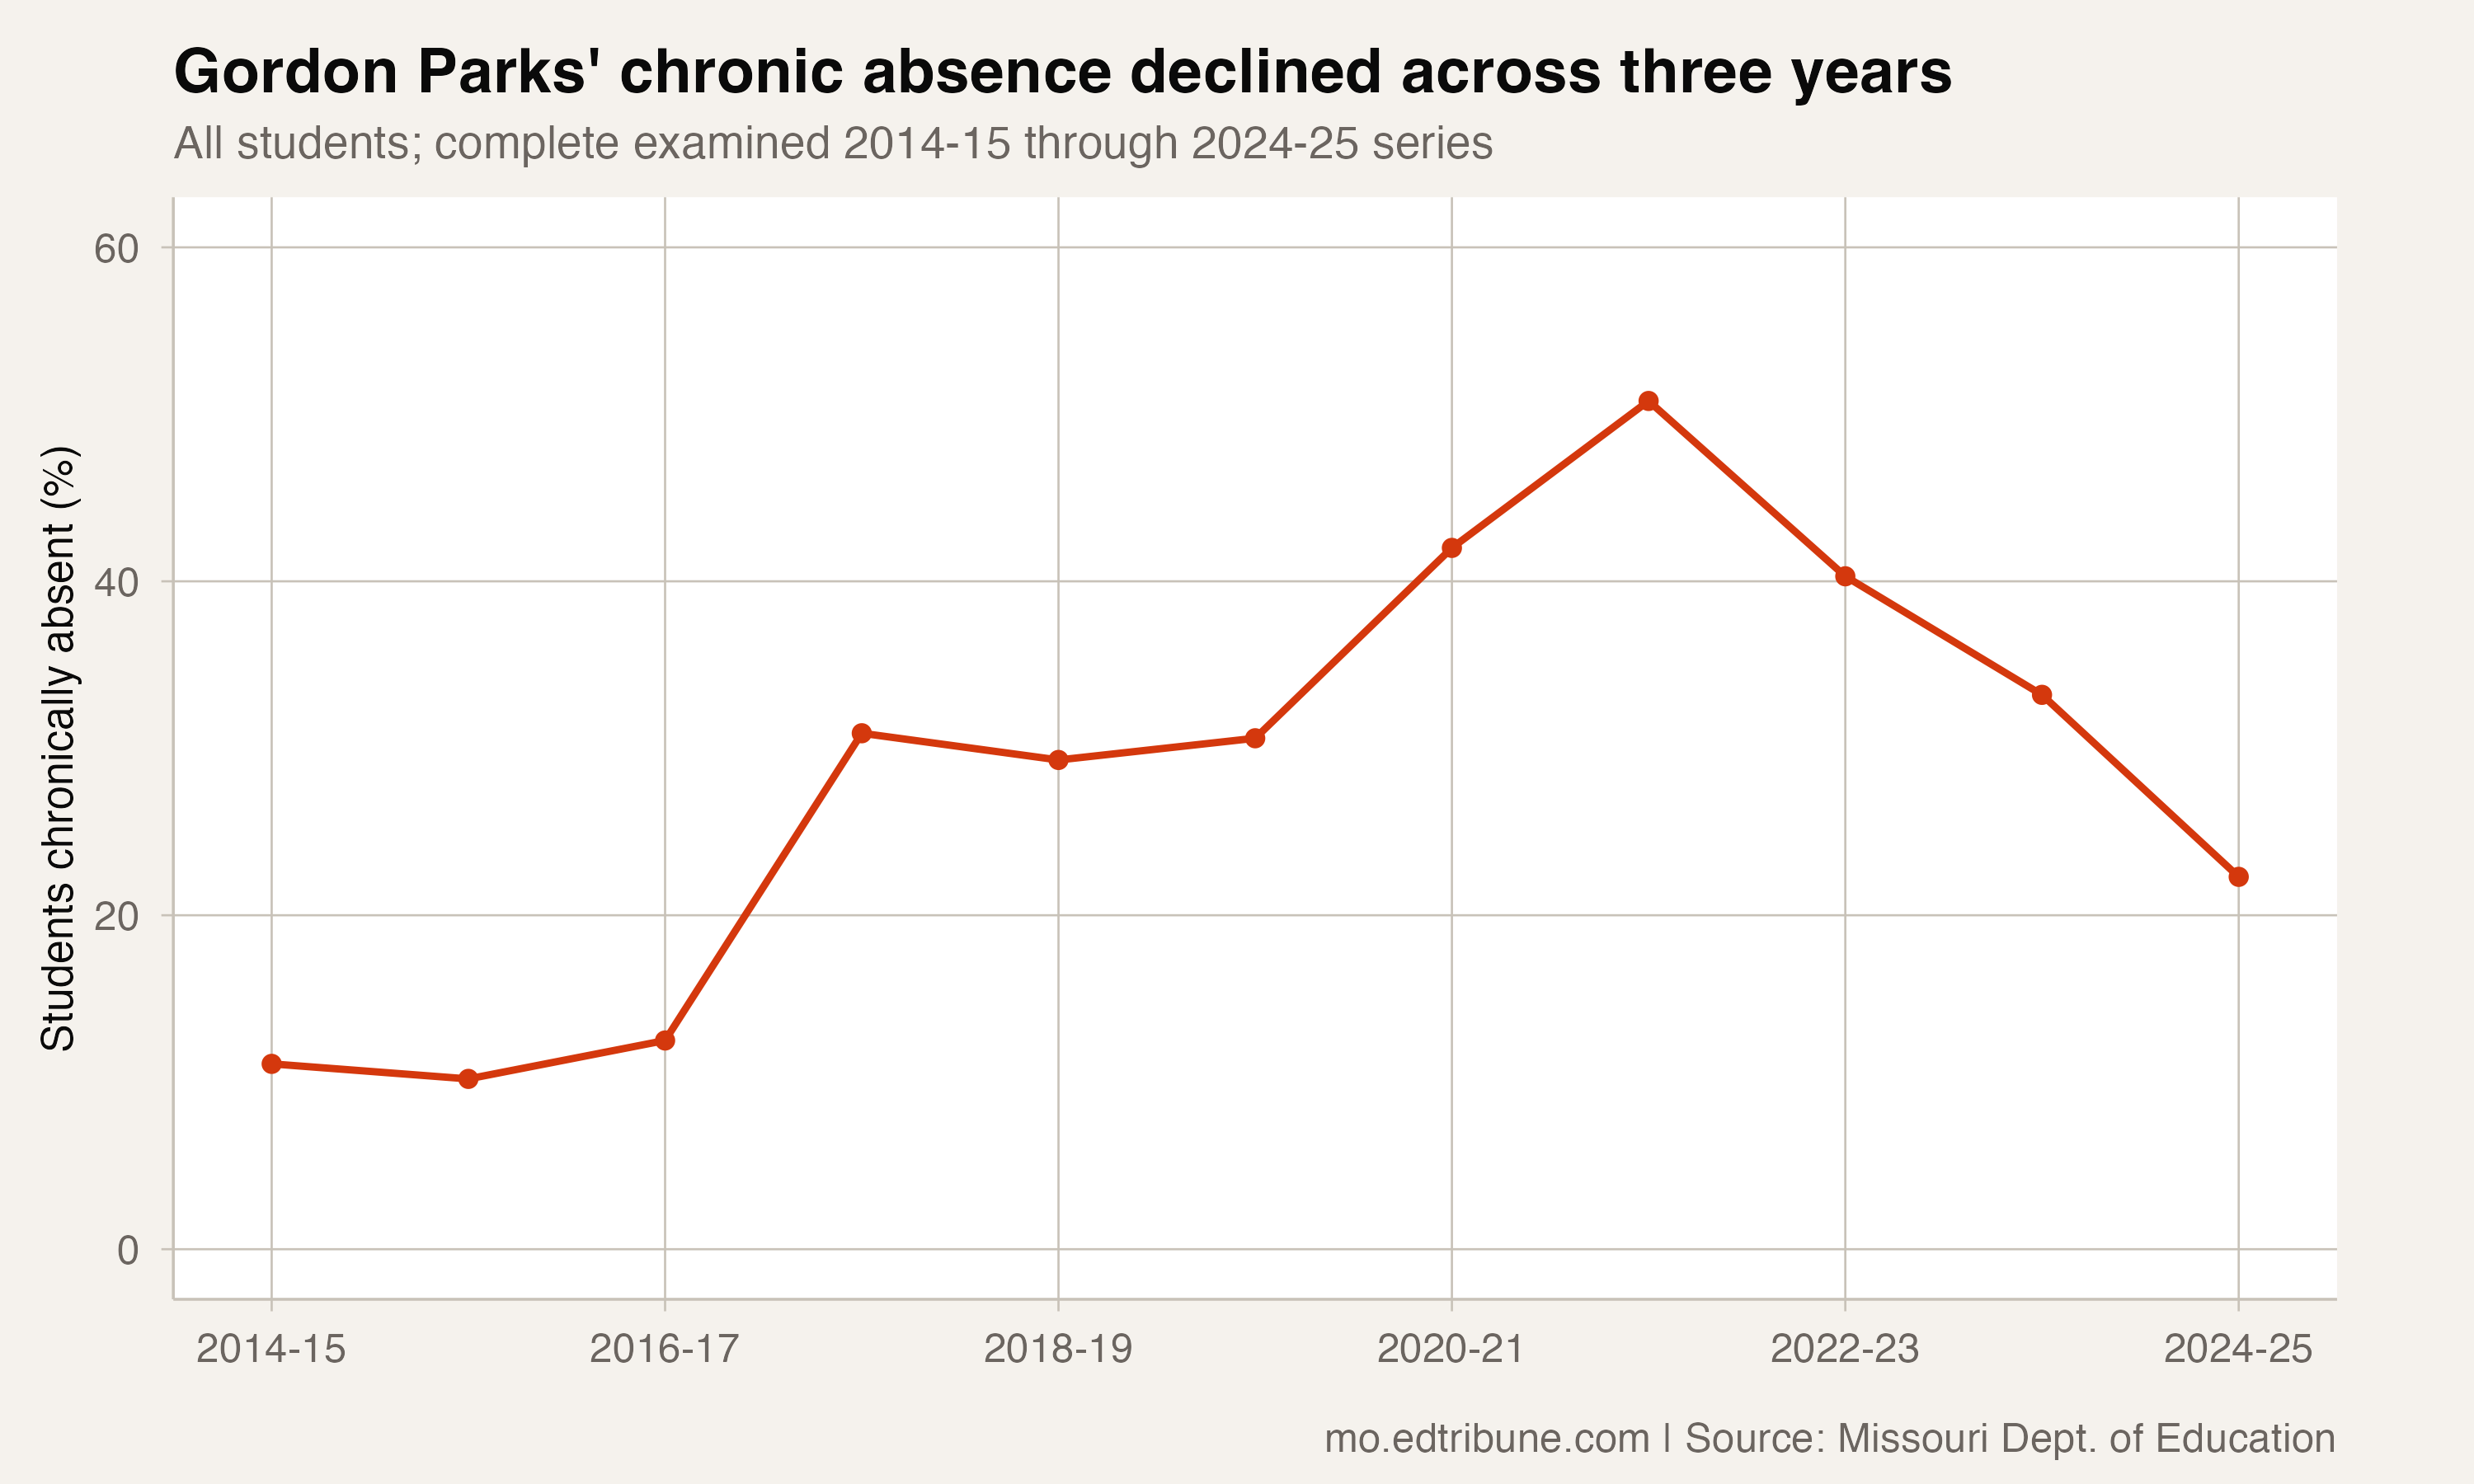
Gordon Parks Elementary reported a 50.8% all-students chronic-absence rate in 2021-22 and 22.3% in 2024-25, an endpoint decline of 28.5 percentage points. Each intervening annual transition was a decline: the reported rates were 40.3% in 2022-23 and 33.2% in 2023-24.
Those figures describe a sustained decline across the stated years. They do not identify the same students improving attendance, and they do not establish which program or other change caused the result.
Named examples of endpoint improvement
The table presents selected examples with complete annual all-students records from 2014-15 through 2024-25. Each peak is the highest reported rate within that window, with the earliest year used in a tie. The final column subtracts the 2024-25 rate from that observed peak.
| District | Observed peak | Peak school year | 2024-25 rate | Decline in percentage points |
|---|---|---|---|---|
| Gordon Parks Elementary | 50.8% | 2021-22 | 22.3% | 28.5 |
| Laquey R-V | 34.0% | 2021-22 | 6.1% | 27.9 |
| Greenfield R-IV | 36.1% | 2021-22 | 9.4% | 26.7 |
| City Garden Montessori | 28.1% | 2022-23 | 1.9% | 26.2 |
| Alton R-IV | 30.3% | 2020-21 | 5.0% | 25.3 |
| Eminence R-I | 33.2% | 2022-23 | 8.3% | 24.9 |
| Grandview R-II | 25.6% | 2020-21 | 1.9% | 23.7 |
| Chilhowee R-IV | 44.4% | 2021-22 | 21.0% | 23.4 |
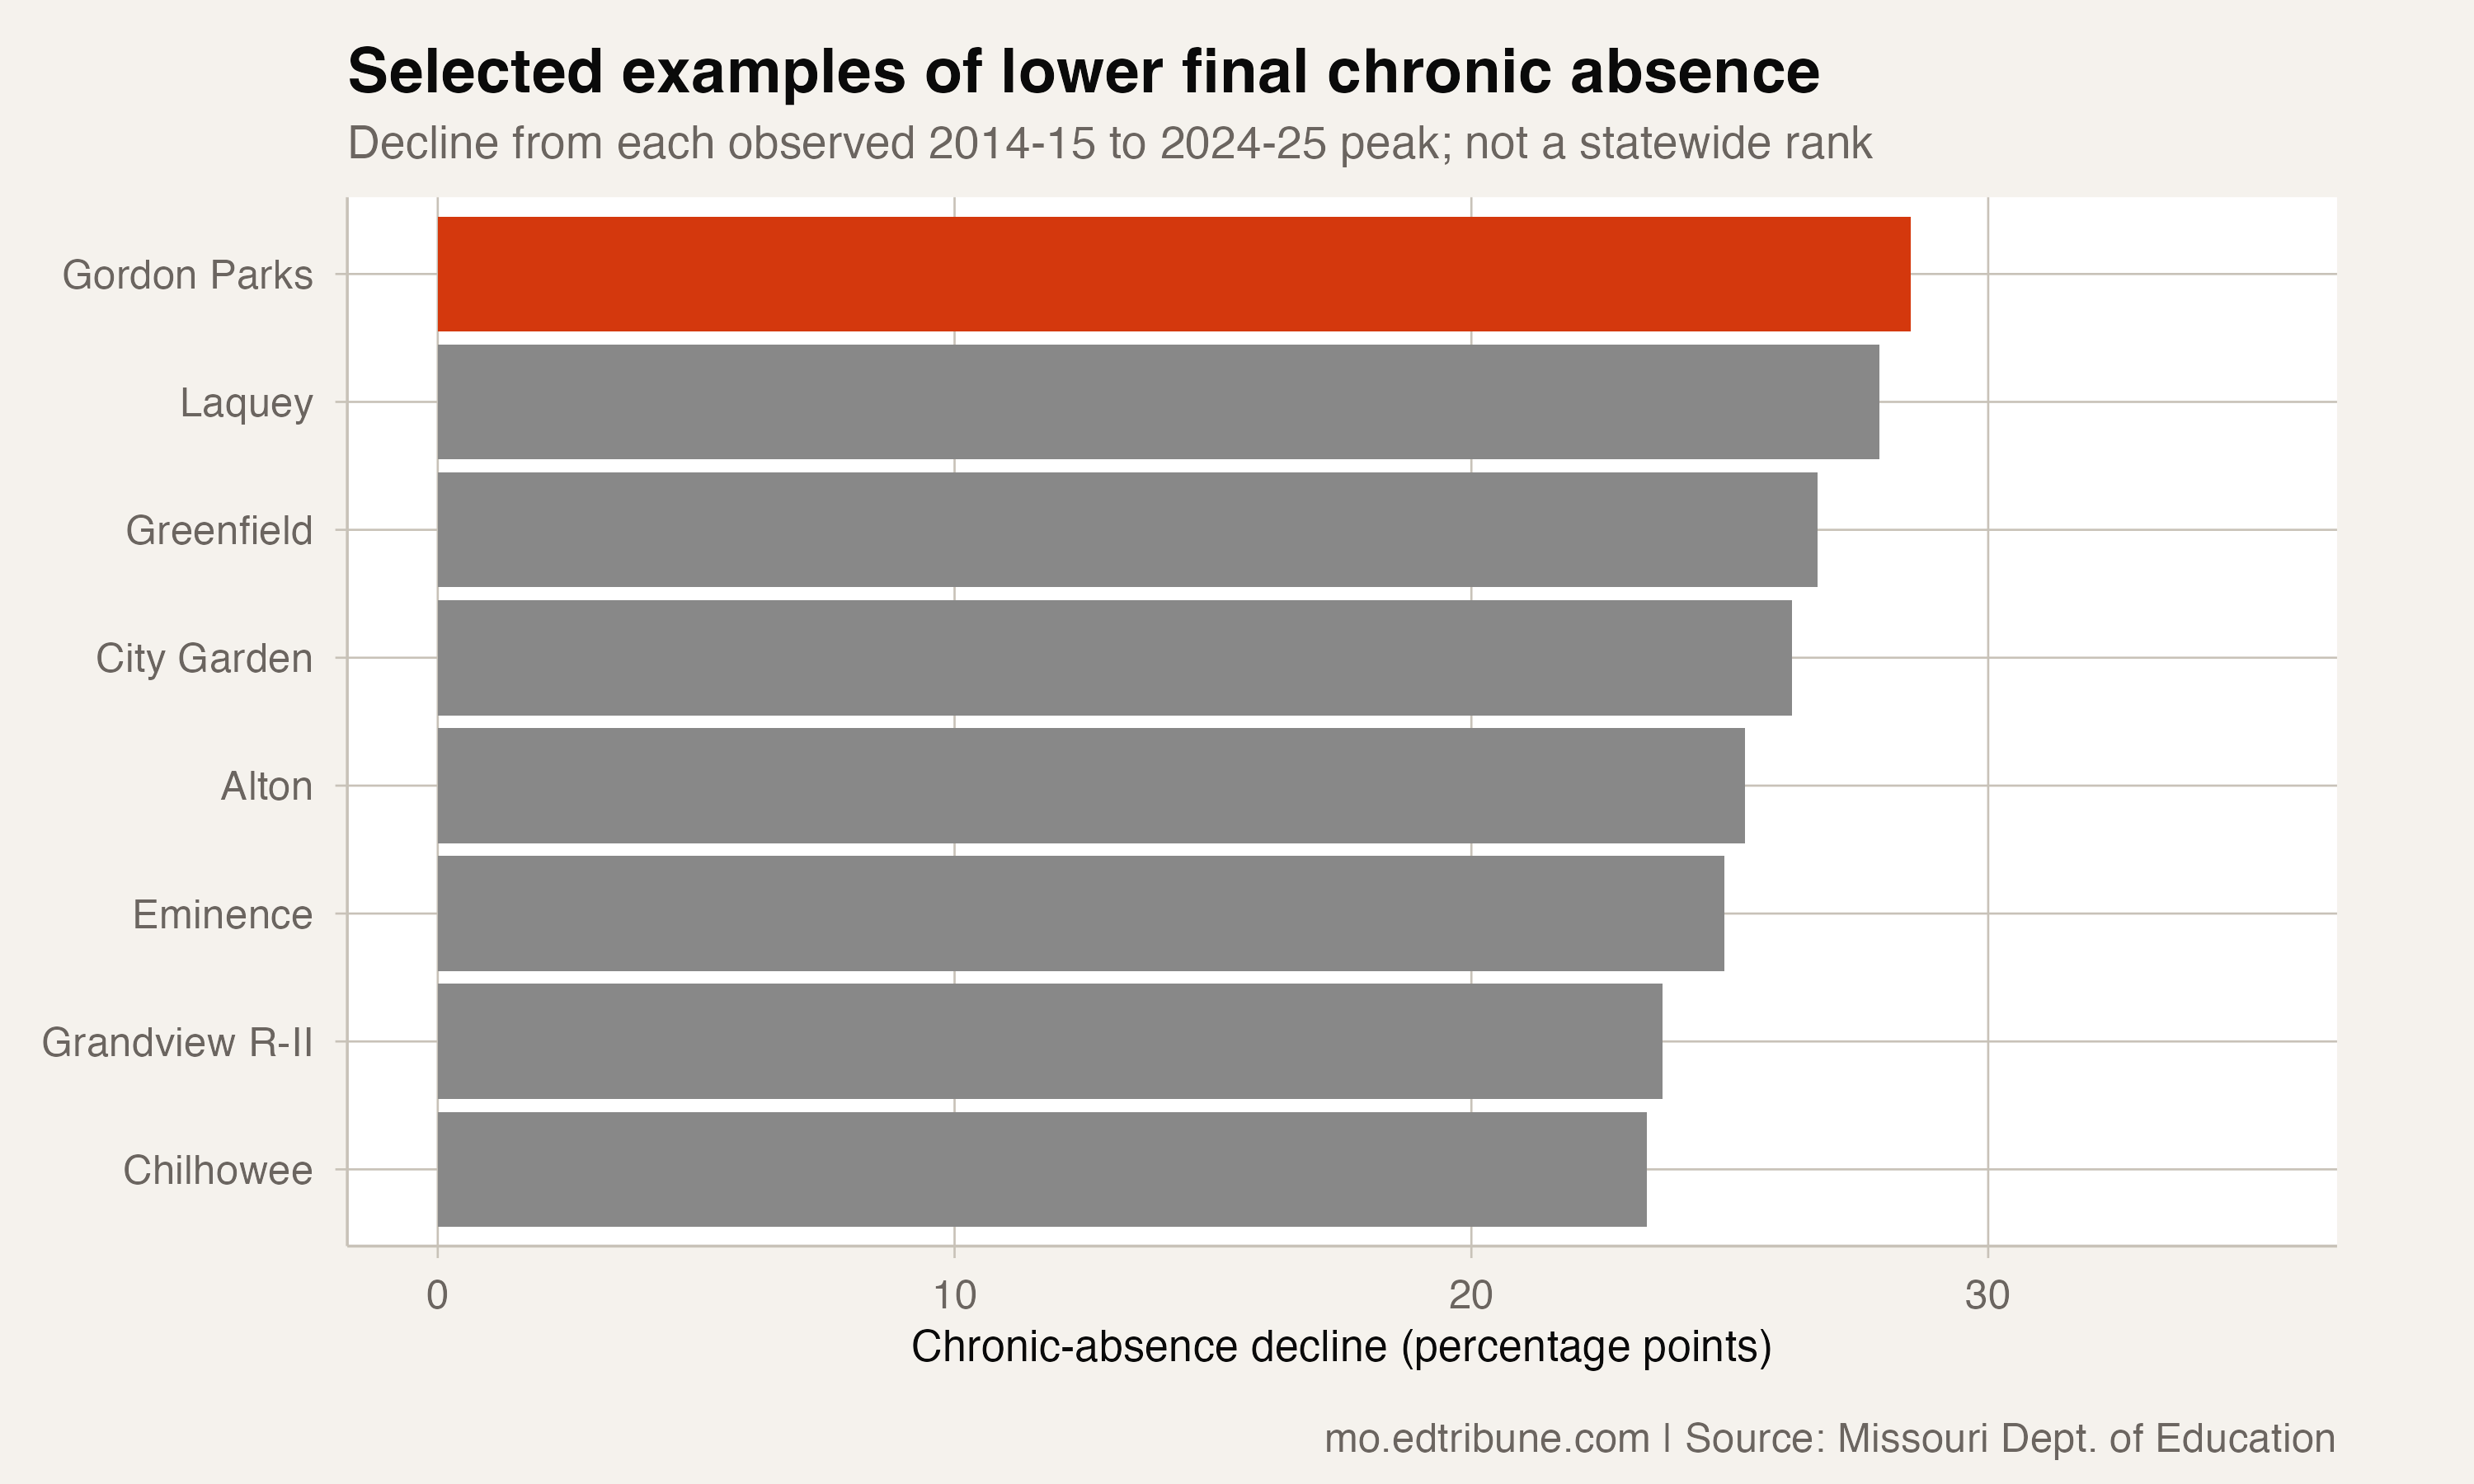
These examples are not a ranking of Missouri's largest recoveries. Other complete district records show larger observed swings, including in the intermediate year that the earlier article excluded. Annual rates alone do not explain whether such swings reflect student changes, reporting changes or other circumstances.
Different annual paths
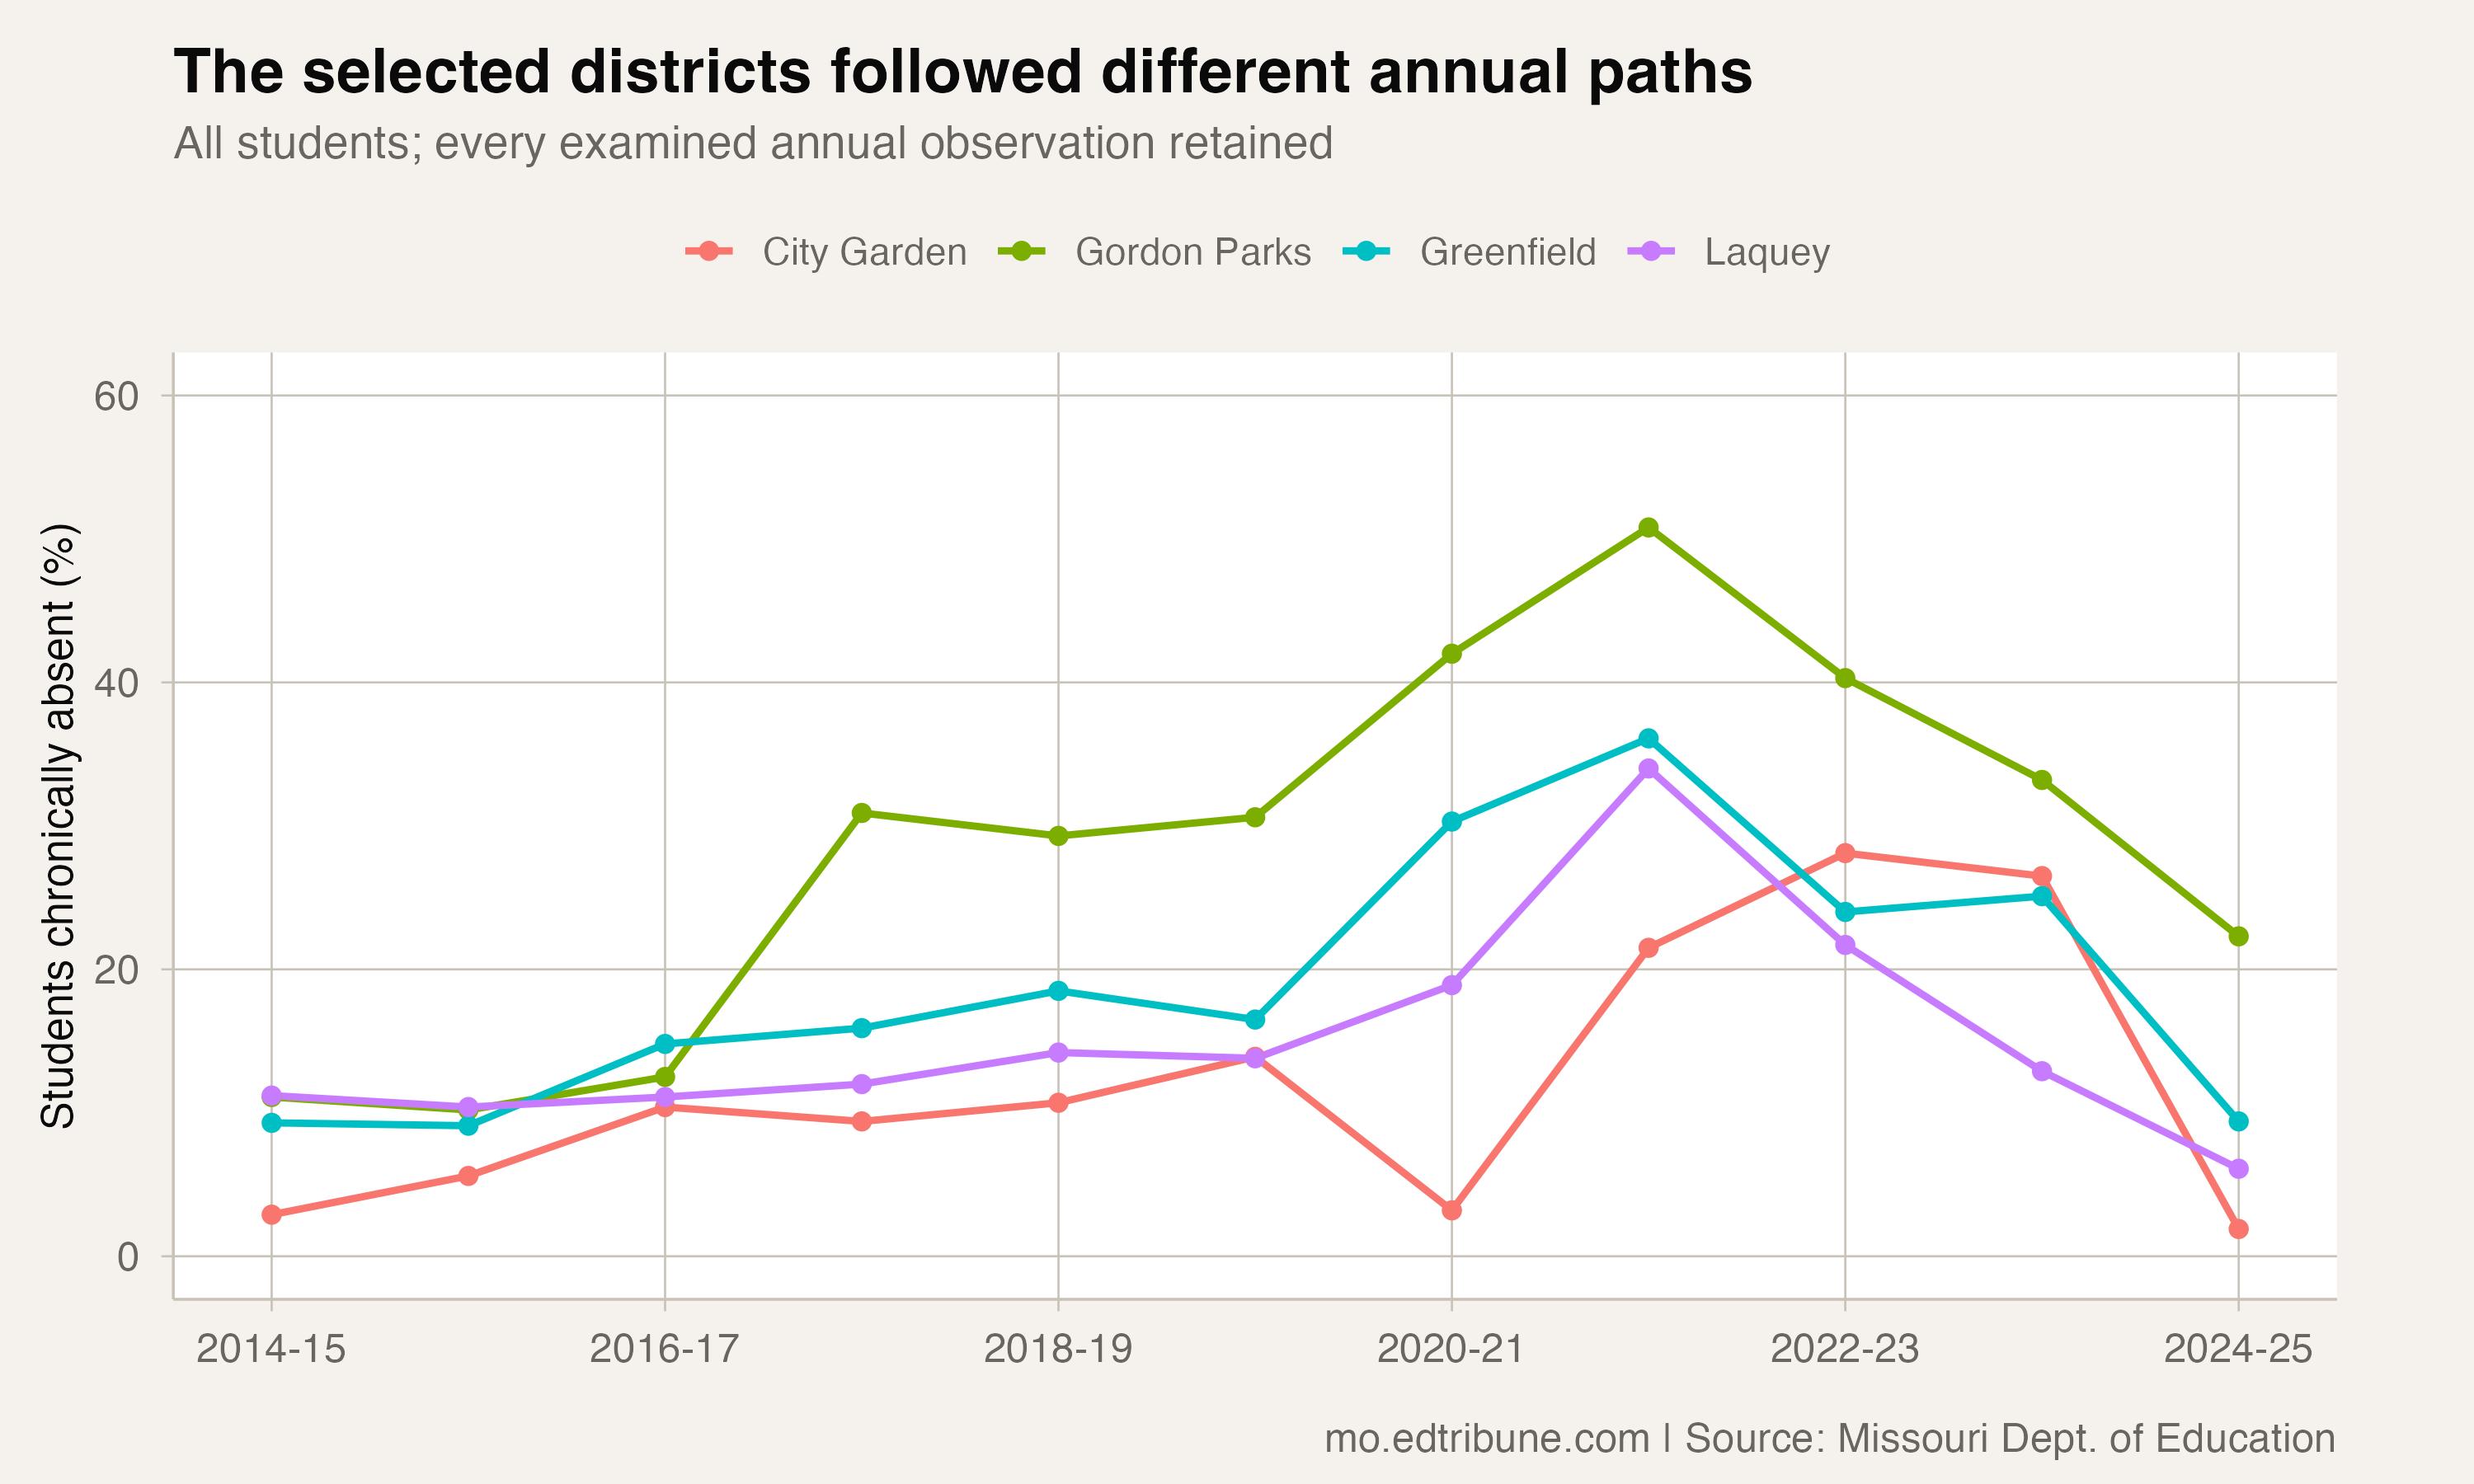
The comparison chart retains every examined annual observation for Gordon Parks, Laquey, Greenfield and City Garden. The districts did not reach their observed peaks in the same year, so the table's endpoint changes are not all changes over an identical duration.
A peak-to-final difference also does not imply that every intervening year improved or that every student group followed the overall pattern. Those questions require separate annual and subgroup tests. The chart supplies the annual paths rather than turning selected endpoint differences into a common recovery mechanism.
The remaining distance and the limits
Gordon Parks' 2024-25 rate was below its 29.3% in 2018-19. It nevertheless remained 0.8 percentage points above Missouri's published statewide all-students rate of 21.5% in 2024-25.
The statewide figure is the separately published state attendance measure. It is not a total reconstructed by adding district enrollment or suppressed categories. The district figures likewise cannot be multiplied by a different enrollment count to establish how many individual students changed behavior.
The improvements in these named examples are measurable. Their causes remain open questions. The records do not support attributing them to charter enrollment choices, family engagement, small district size, schedules or partnerships, nor do these examples alone establish how prevalent recovery was across the whole state.
Data source: Missouri Department of Elementary and Secondary Education.
Detailed code that reproduces the analysis and figures in this article is available exclusively to EdTribune subscribers.
Discussion
Sign in to join the discussion.
Loading comments...